Fancy Black NPD Synthetic Diamond
February 24, 2014
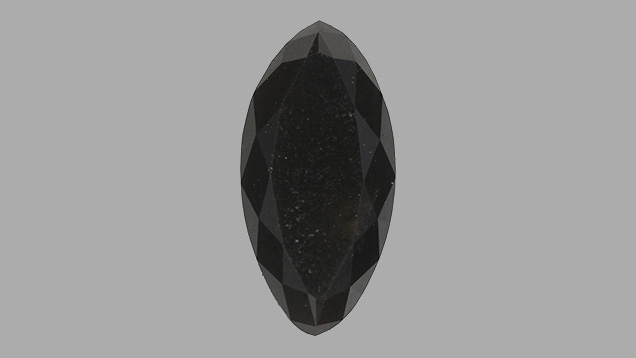
Recently, the New York laboratory tested a small, black marquise-cut stone for identification and color origin. At first glance, the 0.9 ct translucent specimen (figure 1) resembled a typical black diamond submitted to the lab for identification and color origin; one must be careful to separate such stones from synthetic moissanite. This marquise, however, revealed unusual properties strikingly similar to those of the NPD synthetic diamonds reported on by Skalwold, as well as other previously tested samples. These previously studied specimens were transparent with a yellow to brown range of color.

Figure 2. Micrograph images of the heavily included synthetic diamond showed an abundance of graphite inclusions and a murky yellowish matrix. Photomicrographs by Paul Johnson/GIA, fields of view (clockwise): 1.5 mm, 3.1 mm, 1.5 mm, and 4.1 mm.
Unlike natural diamond, the stone in question was heavily included with graphite crystals. The matrix hosting the inclusions had a murky yellowish color (figure 2). Using diffuse reflectance, we obtained a mid-infrared absorbance spectrum strikingly similar to that of the NPD synthetic diamonds reported in the aforementioned article. We observed the diagnostic diamond absorption peaks at approximately 2000 cm–1 and absorption in the one-phonon region, possibly due to nitrogen impurity. Peaks at approximately 3727 and 3611 cm–1 were also observed, as in some previously tested NPD samples (figure 3). Raman spectroscopy is a common and useful technique in identifying a gem diamond. Due to the nano-sizes of the crystals that compose the aggregated sample, a Raman shift is usually not detectable in NPD using visible-light laser excitations. The same feature was observed in this specimen.
Figure 3. The mid-infrared spectrum of the 0.9 ct black marquise-cut synthetic NPD (in red) displayed peaks at approximately 3727 and 3611 cm–1, which have been observed in some other NPD samples. The mid-IR spectrum in 2012 by Skalwold et al. (in blue) is provided for comparison.
Further analysis using the DiamondView instrument revealed a fluorescence pattern and structure that was, again, very similar to earlier NPD samples (figure 4). Raman analysis showed a broad band at approximately 1350 cm–1 and a weak band at about 1580 cm–1; these are assigned as D- and G-bands, respectively (S. Odake et al., “Pulsed laser processing of nano-polycrystalline diamond: A comparative study with single crystal diamond,” Diamond and Related Materials, 2009, Vol. 18, pp. 877–880). Odake reported the two bands in NPD samples grown from high-purity graphite at a temperature of 2600K and a pressure of 15 GPa; both are caused by nanocrystalline graphite or amorphous carbon. Unlike Odake’s samples, which showed G- and D-bands of equal intensity, ours showed a strong D-band with a weak G-band. We measured Raman spectra at many different locations, but did not observe the diamond Raman band at 1332 cm–1, an absence Odake also reported. This suggests the presence of sp2-bonded carbons instead of sp3-bonded carbons.
Figure 4. DiamondView images of the synthetic NPD exhibited a distinct fluorescence pattern. Images by Paul Johnson/GIA.
Testing and observations revealed the diamond to be an NPD synthetic diamond, the first detected by a gemological laboratory.
About the Authors
Paul Johnson and Kyaw Soe Moe are researchers at GIA's New York laboratory.


