Infrared spectroscopy is one of the most versatile analytical techniques widely employed in gemological testing. Its applications include diamond typing (Collins, 2001; Breeding and Shigley, 2009) and identification of irradiated and HPHT-annealed diamond (Woods, 1984; Woods and Collins, 1986; Collins et al., 2000a, b; Reinitz et al., 2000). The technique is also used to detect polymer treatment in emeralds (Johnson et al., 1999) and jadeites (Fritsch et al., 1992) and natural vs. synthetic origin of alexandrite (Stockton and Kane, 1988) and emerald (Adamo et al., 2005). Furthermore, an infrared spectrophotometer equipped with a microscope provides spatial resolution that allows study of micrometer-scale features such as inclusions and zoning, providing valuable insights into a gem’s formation or treatment history.
INSTRUMENTATION
Virtually all infrared instruments are equipped with mid- to near-infrared (~500–7000 cm-1) optics. In this spectral range, they are theoretically capable of micrometer-scale spatial resolution. It is worth noting that far-infrared spectroscopy (~50–400 cm-1) is essential for the study of a material’s lattice vibration, but this technique is not commonly applied in gemological testing due to its additional operating requirements.
Unlike a typical optical microscope equipped with glass optics that absorb a large portion of infrared light, an infrared microscope features all-reflective optics, which ensure coverage of the entire infrared spectral range (~50–10000 cm-1) with minimal loss of signal. The central elements of an infrared microscope are a pair of reflective condensing objectives with a Schwarzschild/Cassegrain design, which focus/collect light to/from samples, allowing both transmission and reflection spectroscopy. Technical and scientific principles are discussed in Griffiths (2009).
One of the infrared systems at the GIA laboratories is equipped with such an all-reflective microscope (figure 1) operating in the mid- and near-infrared spectral region. It features a globar light source, a liquid nitrogen–cooled MCT-A (mercury cadmium telluride) detector, and a KBr beam-splitter. The microscope is coupled to an automated X-Y-Z stage with a 1 micrometer (µm) step interval to allow precision mapping of materials.
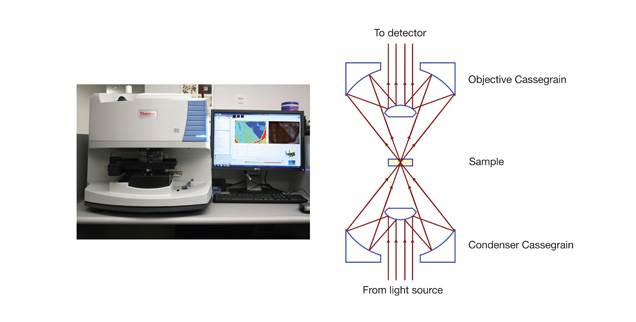
Figure 1. These images show a typical commercial infrared microscope setup (left) and a schematic diagram of reflective Cassegrain objectives (right), the central elements of an infrared microscope.
Common Sampling Techniques Without a Microscope. When an infrared microscope is not used, two types of accessories are commonly applied to direct and focus the infrared beam to the sample. Beam-condensing optics are used for transmission/absorption spectroscopy measurement and diffuse-reflectance infrared Fourier transform (DRIFT) optics for reflection/absorption spectroscopy. These optical components are most suited for macro-size samples larger than a few millimeters. They lack the spatial resolution to analyze sub-millimeter microscopic samples. When a sample is zoned, these types of optics will only provide an average of all spectral features within the sampling area.
APPLICATION
Type Sorting and Identification of Melee Stones. Synthetic (HPHT- or CVD-grown), irradiated, and HPHT-annealed diamonds all bear infrared features that can help in sorting samples for further testing of origin or treatment (Woods, 1984; Woods and Collins, 1986; Collins et al., 2000; Reinitz et al., 2000). But small diamonds are often set in jewelry, which poses a challenge due to the limited optical access. An infrared microscope setup is best suited for this situation (figure 2) and demonstrated by Kitawaki et al. (2008).
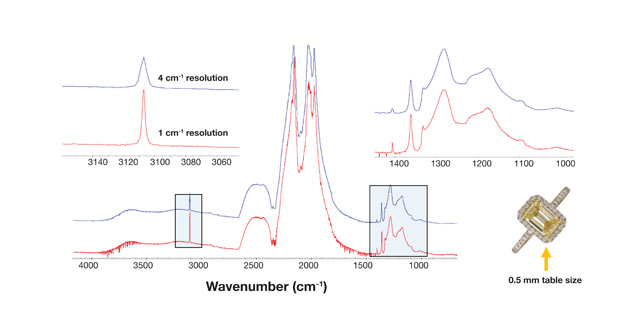
Figure 2. Infrared spectra of a melee diamond set in jewelry can be collected with sufficient quality (16 scans for about 6 seconds) for type sorting or identification. This sample has a table size of ~0.5 mm. Its pavilion is encapsulated in the metal setting, allowing only limited optical access and making it virtually impossible to analyze using a macro-setup such as a beam condenser or DRIFT unit.
Mapping of Defects and Spectral Features. A variety of spectral features within a stone bear valuable information of its growth history and environment. Figure 3 shows a set of mapping data collected from an HPHT-grown synthetic diamond wafer. This wafer is zoned with sectors of both type Ib and IIa characteristics, which can be readily quantified by infrared spectroscopy in the first-order phonon region near 1300 cm-1 (figure 4).
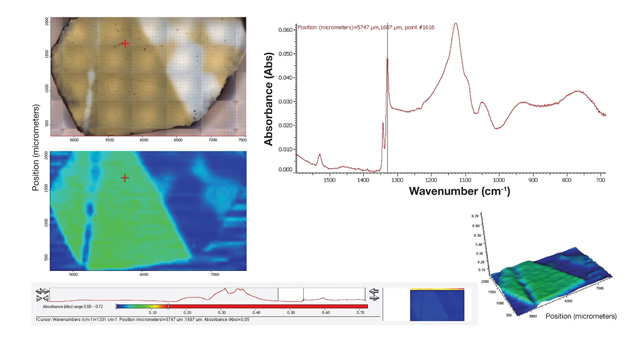
Figure 3. Infrared mapping data of this HPHT-grown synthetic diamond wafer (upper left) show the distribution of nitrogen (bottom left, with green color saturation correlating to nitrogen concentration). The infrared spectrum in the region of interest (upper right, first-order phonon region) is indicated by the red crosses in the left images and full spectral range is shown in narrow strip below, as well as a three-dimensional map of absorbance (lower right). An individual infrared spectrum is stored for each element in the map (50 micron by 50 micron grid in this study, represented by dots in the upper left image). More than 2,000 individual spectra were collected to construct this map, which took about four hours. The process is fully automated once data collection parameters are set up.
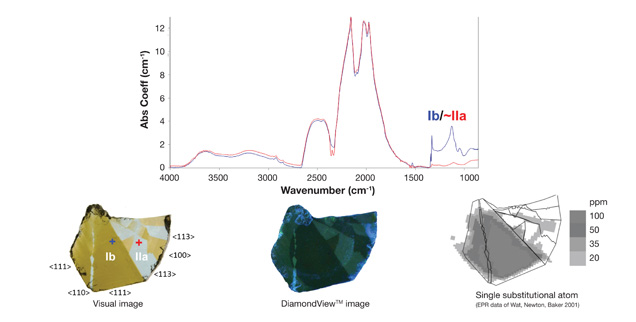
Figure 4. Representative infrared spectra from two sectors (indicated by blue and red crosses) demonstrate distinct type Ib and type IIa characteristics within this synthetic diamond wafer. The photo (lower left), DiamondView image from deep UV excitation (lower middle), and EPR map (lower right) show correlation of regions with various concentration of nitrogen.
Chemical, Structural, and Color Variation. Colored stones are often zoned due to variation in chemical composition, chromophore distribution, and even microscopic inclusions such as clouds. This example of tourmaline exhibits distinct zones of dark green, light green and pink. Quantitative chemical analysis from LA-ICP-MS (laser ablation–inductively coupled plasma–mass spectrometry) indicates an elbaite bulk composition with variation in trace elements responsible for the color zones (author’s personal data). Further analysis of the correlation between hydroxyl (OH), color, and trace-element variation provides insight into the color origin of tourmaline (figures 5–7).
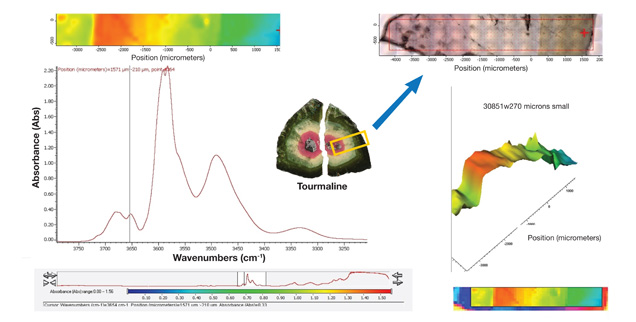
Figure 5. Infrared mapping data of tourmaline show correlation between hydroxyl (OH) variation and color zoning. A thin, doubly polished wafer with 0.27 mm thickness was prepared for quantitative analysis (indicated by the yellow box in the center photo). Infrared mapping spectra and correlating data on trace-element distribution using LA-ICP-MS were collected across the wafer.
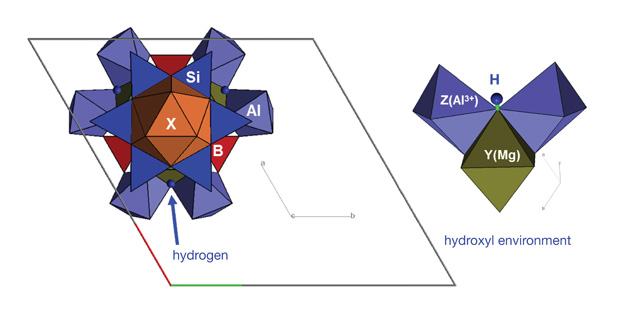
Figure 6. Tourmaline is a boron-bearing mineral with a rather complex crystal structure and multiple structural components (based on MacDonald and Hawthorne, 1995). In the set of mapping data (figure 5), hydroxyl (OH) variation is revealed and can be correlated to LA-ICP-MS chemical analysis for a better understanding of the incorporation mechanism of hydrogen.

Figure 7. Variation in the hydroxyl (OH) spectral region near 3600 cm-1 is shown with correlating zones in the tourmaline wafer (right). Each absorption band is associated with a slight variation of local crystal structural and chemical environment surrounding a hydrogen atom (figure 6).
Other Possibilities. Modern infrared systems equipped with modular optics can be combined with other analyses, such as optical spectroscopy when suitable external light sources and detectors are fitted. Furthermore, highly sophisticated software can perform quantitative analysis of spectral features, such as the ratios and principal components of species in a material.
CONCLUSION
Infrared microscopy is a well-established technique with widespread applications in routine gemological testing and research. Its micrometer-level spatial resolution extends infrared spectroscopy to the microscopic world of gemstones. The microscopic and quantitative aspect facilitates coordinated study with other spectroscopic techniques (e.g., Raman and UV-visible) and methods of chemical analysis (e.g., LA-ICP-MS). This will undoubtedly further our understanding of a gem’s characteristics, growth history, and color origin.


