Applications of X-Ray Radiography and X-Ray Computed Microtomography in Gemology
ABSTRACT
X-ray radiography and X-ray computed microtomography are two imaging techniques with far-reaching applications in many fields. In gemology, they play a crucial role in the identification of pearl, a unique biogenic gem material. This article offers a brief history of pearl testing by X-ray imaging, as well as basic instrumental theory, examples of different types of pearls that can be separated with X-ray imaging, and examples of its other uses in gemology and mineralogy. The aim of this paper is to provide readers with a basic understanding of these methods and the importance of these devices in a gemological setting, particularly for pearl testing.
In 1895, Wilhelm Conrad Roentgen captured the first X-ray image, which showed the bones inside his wife’s hand and the ring on her finger (Roentgen, 1896). This discovery revolutionized how scientists probe the human body and the structure of crystals and atoms (Assmus, 1995). Just two years prior, in 1893, Kokichi Mikimoto had begun experimenting with culturing pearls using the so-called akoya pearl oyster (Pinctada fucata) in Japan. Mikimoto succeeded in culturing hemispherical shell blisters and subsequently gem-quality spherical cultured pearls that would forever change the pearl industry (Nagai, 2013). These two seemingly unrelated events would eventually meet, as X-ray imaging technology became an essential part of pearl testing worldwide.
Natural pearls have been cherished since the dawn of civilization. Many mollusk species from the Bivalvia and Gastropoda classes are known to produce pearls naturally, often as a response to a foreign particle irritant in their soft mantle tissue. This tissue is responsible for the biomineralization of shells by producing calcium carbonate. Before the advent of pearl culturing, gem-quality pearls were extremely rare and expensive, reserved almost exclusively for the wealthy elites globally. By the beginning of the twentieth century, pearl oyster beds and freshwater mussel populations around the world had been depleted significantly by overharvesting. (Later, the discovery of oil in the Persian [Arabian] Gulf caused further reduction of natural pearl production.) Mikimoto’s successful commercial production of akoya cultured pearls had a profound impact, providing an affordable alternative that was almost indistinguishable from natural pearls. This shift created an urgent need for new technologies that could distinguish between natural and cultured pearls.
Several major gemological laboratories were established in the early twentieth century. These included the gem testing laboratory of the London Chamber of Commerce (which later became the laboratory of the Gemmological Association of Great Britain) in 1925, the Laboratoire Français de Gemmologie (LFG) in 1929, and the Gemological Institute of America (GIA) in 1931. All of them initially focused their efforts on the identification of natural and cultured pearls. At first, Laue diffraction using X-ray (along with endoscope analysis using optic light) played an important role in separating natural pearls from akoya cultured pearls containing a shell bead nucleus (Anderson, 1932; Shipley Jr., 1934; Bloch, 1937; Alexander, 1941; Barnes, 1946, 1947; Scarratt and Karampelas, 2020). It was found that the X-ray diffraction patterns obtained are due to the presence of aragonite crystals. Natural pearls displayed the typical spoke-like diffraction pattern (also known as a six-spot pattern), while cultured pearls produced a “Maltese” cross pattern (also known as a four-spot pattern) (Alexander, 1941; Scarratt and Karampelas, 2020). While the diffraction patterns of saltwater natural pearls and some bead cultured akoya pearls are distinctly different, some cultured akoya pearls with thick nacre (containing a small bead nucleus inside) can produce the same pattern found in a natural pearl, which is misleading. In addition, some freshwater natural pearls may exhibit diffraction patterns similar to those of bead cultured pearls. Furthermore, the relatively long exposure time of X-ray diffraction and its inability to examine multiple pearls at the same time eventually led to the adoption of X-ray radiography in pearl testing.
In the early twentieth century, gemologists began using X-ray radiography to detect pearls inside mollusk shells and distinguish natural and cultured pearls (Kempton, 1922; Alexander, 1941). While X-ray diffraction was used to analyze the crystal structure and atomic arrangement within a pearl’s nacre layers, X-ray radiography creates a 2D image of the internal structures of a pearl by measuring the attenuation of X-rays as they pass through it. Because of technology limitations, the images obtained during that time often failed to clearly show the difference in density between the nacre and the nucleus of a cultured pearl. In 1950, a newly designed X-ray instrument was introduced by the Gemmological Laboratory of the London Chamber of Commerce. This apparatus, slightly larger than a household refrigerator, was capable of producing both radiography images and readily observable luminescence (Webster, 1950). X-ray luminescence marked a significant advancement, as it could separate saltwater pearls from either freshwater pearls or pearls cultured with freshwater shell bead nuclei, based on differences in luminescence caused by trace element concentrations of manganese (Hänni et al., 2005).
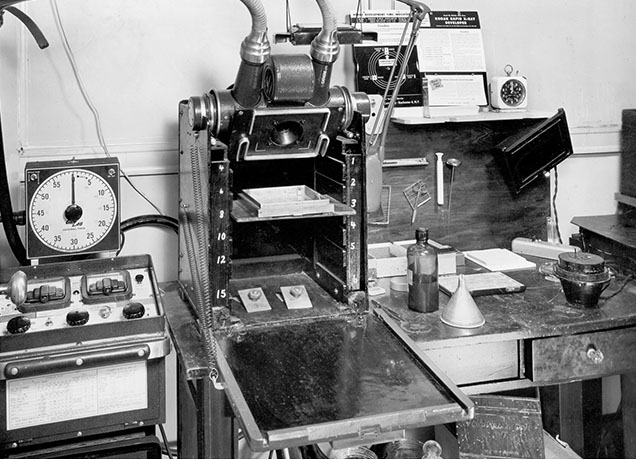
The following year, the GIA Gem Trade Laboratory in New York installed a similar instrument specially adapted and designed for pearl testing (figure 1) with the ability to generate radiography images and readily observable luminescence. It generated detailed images of the concentric nacreous layers surrounding the nucleus of a cultured pearl. The basic operating procedure of these early machines was to direct a beam of X-rays at a specimen with X-ray sensitive film placed directly behind it. The pearls were sometimes immersed in carbon tetrachloride to minimize traces of surface reflection and refraction. After exposure to the X-rays, any differences in the structural density of the specimen would cause uneven absorption of the X-ray beam, and the resultant image recorded on film would show these characteristics (Benson, 1951). The entire process of capturing a single X-ray image often required 15 to 20 minutes. As more modern X-ray units were introduced in the decades that followed, the underlying concept of radiography remained an essential method for differentiating natural and cultured pearls (Zhou, 2019).
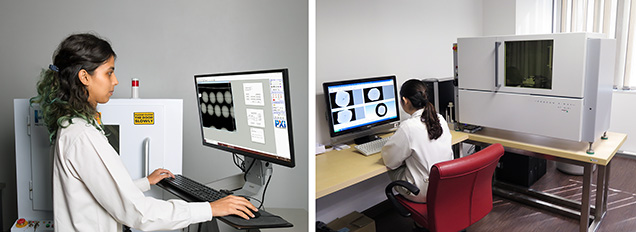
In recent decades, digital X-ray equipment has largely replaced film-based systems in gemological laboratories. The transition from image intensifiers to flat-panel detectors and the adoption of X-ray computed microtomography (μ-CT) have further enhanced image resolution, allowing the detection of fine growth features inside a pearl (Karampelas et al., 2010, 2017; Krzemnicki et al., 2010). These more advanced instruments are also used by GIA for pearl identification services in various laboratory locations (figure 2).
This article reviews general theories of X-ray radiography and μ-CT and explains their working mechanisms. While the main application of these techniques in gemology is to separate natural and cultured pearls, we will briefly cover their use in examining other gems and minerals. Examples of 3D reconstruction of μ-CT data further demonstrate the capability of such instrumentation in revealing the secrets hidden inside these unique biogenic gems, such as unusual materials used as nuclei in the culturing process.
X-RAY IMAGING THEORY
X-ray radiography is a powerful tool for visualizing the internal structures of an object based on the differential absorption of X-ray photons. A basic X-ray imaging system consists of three components:
1. An X-ray source that emits a beam of X-ray photons
2. A sample that absorbs X-rays; this absorption is dependent on the material’s composition and density.
3. A detector that enables X-rays to be imaged. Modern systems typically use a special digital image sensor, but X-ray film or a fluorescent screen could also be used.

Figure 3 shows an illustration of these basic components. To optimize image quality, it is important to understand how each component works. The following sections explain the principles of each component and how they operate in modern X-ray radiography. Rather than an exhaustive explanation of the underlying physics, this article will focus on practical aspects of X-ray and μ-CT data collection and interpretation. For a more comprehensive overview of the theory and physics of X-ray generation, refer to Als-Nielsen and McMorrow (2011). A review of X-ray imaging is available in Ou et al. (2021). For a review of μ-CT imaging, refer to Molteni (2020) and Withers et al. (2021).
X-Ray Generation. Most commercial systems generate X-rays using an electrically driven X-ray tube. A user can control two parameters: voltage (kV) and current (mA) of the X-ray source. Voltage has the greatest impact, determining the energy distribution and overall number of X-ray photons emitted. Current influences the number of X-ray photons produced but has a less dramatic effect than voltage.
There are many different designs of X-ray tubes, but all operate based on the same fundamental principle. X-rays are generated by shooting a focused, high-energy electron beam onto a metal “target.” The electrons in the beam are accelerated toward the target by applying a high voltage (10–300 kV) between the anode and cathode of the X-ray tube, based on the voltage applied; the energy of these electrons is measured in thousands of electron volts (keV). When the electrons strike the target, this generates either continuum X-ray emission (photons emitted over a broad continuous energy range) or characteristic X-ray emission (photons with a fixed energy level specific to the target material’s elemental composition). In both cases, X-rays are produced when electrons lose their kinetic or potential energy and emit photons with energy corresponding to the difference in electron energy level. These photons are also measured in electron volts. In modern laboratory X-ray imaging systems, the target material is usually either tungsten for high-energy X-rays (K⍶1 = 59.3 keV), suitable for imaging denser materials, or molybdenum for lower-energy X-rays (K⍶1 = 17.5 keV) suitable for high-contrast imaging of low-density materials. X-ray generation takes place under a vacuum since electrons are deflected and lose energy interacting with gas molecules. The X-rays lack an electric charge and thus pass through air unimpeded. They are directed out of the vacuum tube through a low X-ray absorbing “window” and toward a sample.
X-Ray Absorption. Differences in a sample’s X-ray absorbance provide the contrast within an image. X-ray absorption is sensitive to the chemical composition, the amount (thickness and density) of material between the X-ray source and the detector, and the energy of the X-rays. Materials with heavier elements (higher average atomic number) will absorb more X-rays. This absorption is proportional to the average atomic number to the third power (z3) (Hubbell and Seltzer, 1995). For a material with a uniform density, the X-ray absorption will follow the Beer-Lambert law, meaning the absorption is proportional to the thickness of the material. Roughly speaking, the more atoms there are and the higher their atomic number, the greater the likelihood the X-rays will be absorbed (transferring their energy to the material’s atomic structure).

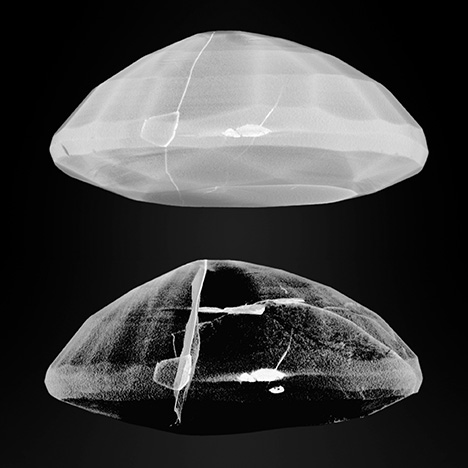
The example in figure 4 (left) shows an X-ray image of an oval-cut ruby with lead glass–filled fractures viewed from the side of the stone. In an X-ray image, the darker-looking structures absorb more X-rays (i.e., fewer photons pass through the material). The lead glass appears as dark, distinct structures within the body of the ruby. The sharp contrast is due to the difference in the chemical composition of the materials—the lead in the glass has higher absorption than ruby, which is made of lighter elements aluminum and oxygen. The thin, wispy vertical fractures are not as dark as the thick horizontal fractures toward the top of the image. This difference in absorbance is due to the difference in material thickness along the path of the X-rays through the sample and to the detector. If the ruby were imaged at a different orientation, the pattern would change. If it were oriented so that the plane of the crack was perfectly aligned to the X-ray path, the lead glass along that path would be thicker than the horizontal features and thus absorb more X-rays. The ruby also shows differences in X-ray absorption depending on its thickness. The center of the ruby (where the cross section is thickest) is darkest, with decreasing absorption toward the rim where there is less material for the X-rays to penetrate. In gemology, it is customary to collect X-ray images with inverted contrast (also called negative imaging) (figure 4, right), as shown in the rest of the X-ray images in this article.
Absorption is also sensitive to the energy of the X-ray photons. Lower-energy photons are more easily absorbed than high-energy photons, which pass through the material with less likelihood of being absorbed. This differential absorption allows high-energy X-rays to penetrate dense objects better, while lower-energy X-rays provide better contrast between materials. A user generally controls the energy of the X-ray beam by adjusting the voltage applied to the X-ray tube. This sets the maximum energy of the X-rays being emitted. To reduce the energy of X-rays, users can “filter” the beam by using a thin sheet of metal to block low-energy X-rays. This can narrow the energy range of the X-ray beam, helping minimize artifacts due to the differential absorption of X-ray energy.
X-Ray Detection. In much the same way a digital camera operates, a digital X-ray image sensor converts X-ray photons into a digital image. A grid of pixels measures the relative number of photons that hit the detector within a set exposure time and reads out the signal as an image. The X-rays first pass through a material called a scintillator, which fluoresces visible light in response to X-ray excitation. The visible light is then measured by an imaging detector and converted to a digital signal. The more X-rays hitting the scintillator, the greater the signal. By default, this creates images with contrast opposite to older X-ray sensitive film, which creates negative images based on a photochemical reaction that leaves the areas exposed to the most X-ray photons darker than areas exposed to fewer. This means that structures with higher absorption will appear brighter on a film X-ray image. Due to the longtime use of film X-rays in medical imaging, most people think of more highly X-ray absorbing structures, such as bones, as appearing white in X-rays. To maintain consistency with this convention, many digital X-ray systems invert the contrast on the image to show areas with less X-ray signal as brighter than those with more.
In digital X-ray imaging, the user sets the exposure time for each image to ensure enough signal is being collected to avoid underexposure or overexposure. Underexposing means there are not enough photons passing through the sample to provide adequate contrast in the image. This can often be the result of image noise, due to random fluctuations in the number of photons traveling through the material or electrical signals in the detector. Overexposure occurs when too many photons strike the detector and overwhelm the detector’s ability to measure additional signals. This results in an image that appears washed out and overly bright, with reduced contrast in the sample.
Two main types of X-ray detectors are used in modern digital X-ray imaging. X-ray image intensifiers are vacuum tubes that convert X-rays into visible light, creating an image. First, the incoming X-ray photons are converted to light photons using a phosphorescent material, and then they are further converted to electrons via the photoelectric effect inside a photocathode. These electrons are accelerated and focused toward the output phosphor using an electron optic system. At the end, the output electrons are converted back to visible light, which can be captured by a camera. In recent years, flat-panel detectors have become the state of the art in X-ray detector technology for radiography and μ-CT applications. Introduced in the mid-1990s, they offer a direct digital readout of the X-ray image and an increased spatial resolution (Berger et al., 2018). GIA currently utilizes X-ray imaging devices containing both types of X-ray detectors at various global laboratory locations, mainly for pearl identification services.
Basics of μ-CT. X-ray computed microtomography is a technique that combines X-ray images of a specimen from multiple perspectives, collected either by rotating the specimen or alternatively the X-ray source and detector, and converts them into a digital 3D representation. These 3D representations are typically viewed as cross-sectional images. Sir Godfrey N. Hounsfield created the first computed tomography scan of a human brain in 1971 and a full-body computed tomography device in 1975, breakthroughs that earned him (with Allan M. Cormack) a Nobel Prize in 1979. Cross-sectional images obtained by μ-CT are in terms of micrometer scale, which has a higher spatial resolution in the range of 1–10 μm for better detecting internal structures and geometries of tiny features in small objects, such as growth features in a pearl. The main components of the microtomography device are the X-ray tube, a computer-driven step motor that intermittently rotates the mounted sample, a radiation filter and collimator (which focuses the beam geometry to either a fan- or cone-beam projection), a specimen stand, and a scintillator-coupled digital X-ray detector. Microtomography was regarded as a revolutionary development (Boerckel et al., 2014; Orhan, 2020).
Data acquisition using μ-CT involves consideration of several factors, including sample size, resolution, voxel size (the 3D analog of a pixel), scan time, number of images, and rotation options. The X-ray source needs to be aligned with and centered on the X-ray detector. Total acquisition time is a balance between the number of images collected and the time it takes to collect a single image. The major consideration for scan time is the acquisition time of single projection images, which can vary from system to system due to detector sensitivity and dynamic range differences, X-ray tube brightness differences, and differences in physical distance from source to detector (du Plessis et al., 2017). The quality of a single image, particularly the contrast between features of interest and noise level, will determine much of the contrast in the final 3D images. The number of images taken at different rotational positions will affect the geometric accuracy of the 3D cross sections as well as the image quality. For pearl testing at GIA, a quick μ-CT scan of a median-sized pearl (around 7 mm) takes as little as 20 minutes to complete.
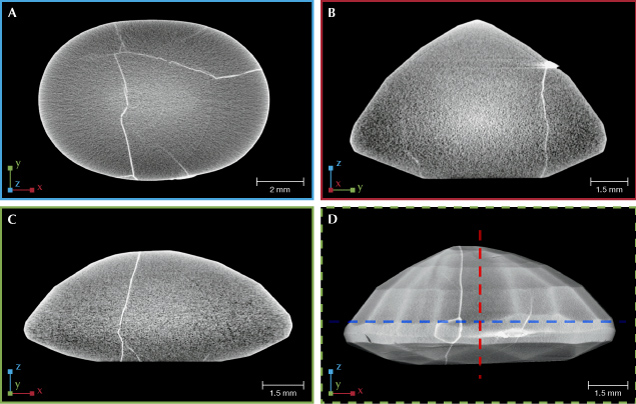
After data acquisition, the next step is the reconstruction of all 2D image projections into a 3D volume and the rendering and segmentation of the 3D volume using special software. Reconstruction produces 2D cross-sectional images or “slices” perpendicular to the rotational axis, and rendering converts these images to 3D objects that can be digitally manipulated. The data can be crosscut in different orientations to reveal alternate views of the material’s interior. This is seen in figure 5, which shows various cross sections of a lead glass–filled ruby. Note that in the μ-CT reconstruction, the contrast between the lead glass and the ruby correlates to material density and chemistry, not the absorbance seen in 2D X-ray radiographs. This is because the 3D reconstruction algorithm corrects the path length of the absorbance by combining the 2D radiographs of the sample from different angular positions. Ideally, the contrast of the 2D cross-sections would only relate to the sample’s material properties, but there are several artifacts that can distort the final images. Some of these include shadowing or bright streaking caused by very dense objects; ringed artifacts surrounding the axis of rotation; and so-called beam-hardening from the higher absorption of lower-energy X-rays in the thickest part of the sample which can make objects appear more absorbing than they actually are. For a more complete description and examples of μ-CT artifacts, refer to figure 7 in Withers et al. (2021).
The μ-CT data can be rendered and viewed in 3D; a user can also digitally segment the data to highlight different structures and features of interest. This is demonstrated in figure 6, where the lead glass within the ruby seen in figure 5 has been exposed by reducing the opacity (alternatively referred to as transparency) of the surrounding ruby in the 3D rendering. This powerful research tool makes it possible to virtually explore, manipulate, extract, and reconstruct specific areas of an object for analysis. It also gives researchers the ability to enhance existing μ-CT data to see details more clearly.
APPLICATIONS IN PEARL TESTING
Since the 1950s, X-ray radiography has been the main method to separate cultured and natural pearls, as the examiner is able to observe the internal growth structures below the nacre. Pearl imitations such as coated glass or plastic beads can also be detected through this method. In the realm of testing, pearls can be broadly separated into three major groups: bead cultured, non-bead cultured, and natural.
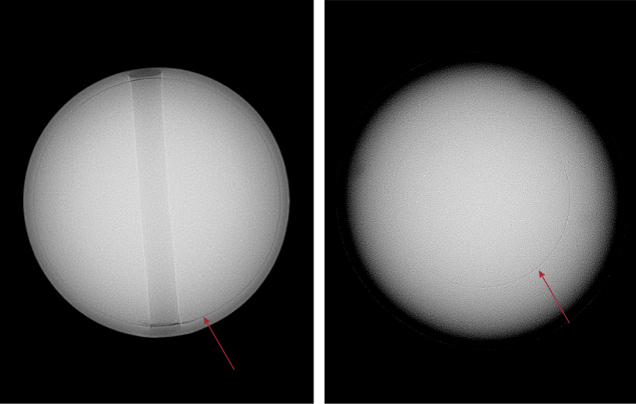
To create bead cultured pearls, a skilled technician takes mantle tissue from a donor mollusk of the same species and inserts a shell bead along with it into a host mollusk’s gonad. The mantle tissue grows and forms a sac around it and secretes nacre inward and onto the bead to eventually form a bead cultured pearl (Strack, 2006). These pearls are relatively straightforward to identify under X-ray radiography, as their internal structure usually shows a clear and continuous demarcation line that separates the shell bead nucleus and nacre layers that cover the bead, with no additional growth features inside the shell bead structure. Gemologists are able to gauge and measure the nacre thickness using X-ray radiography. An example can be seen in figure 7, which shows two bead cultured pearls of different size and nacre thickness. The pearls are created by different Pinctada species mollusks, which in turn affects the size of the pearl. Pearl size also depends on the size of the shell bead nucleus inserted and the duration of the culturing period.
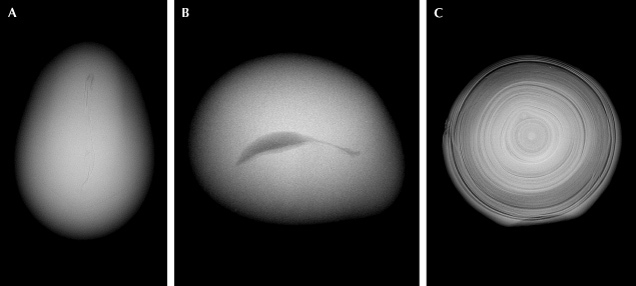
While bead cultured pearls are relatively simple to identify, cultured pearls that do not contain a bead nucleus, known as non-bead cultured pearls (or beadless cultured pearls), can be more challenging. These usually occur as byproducts of bead culturing practices but can also result from intentional culturing (particularly freshwater cultured pearls). The internal structures of non-bead cultured pearls can vary significantly, often featuring irregular linear features, irregular void features, or evenly spaced alternating nacre and organic layers with a white core in the center (Scarratt et al., 2000; Krzemnicki, 2010; Sturman et al., 2016a,b; Nilpetploy et al., 2018; Al-Alawi et al., 2020; Homkrajae et al., 2021b). Examples of these structures are shown in figure 8.
Unlike cultured pearls, natural pearls are formed by various saltwater and freshwater mollusk species inside a natural pearl sac, without human intervention. Each natural pearl exhibits unique internal growth features when examined under X-ray radiography, such as the classic “onion ring” or “tree ring” concentric growth structure. However, examination using both destructive and nondestructive methods has revealed that the growth patterns inside natural pearls are much more complicated than typically described. These involve intricate building blocks from various polymorphs of calcium carbonate and complex mixtures of organic compounds (Vasiliu, 2016; Homkrajae et al., 2021a).
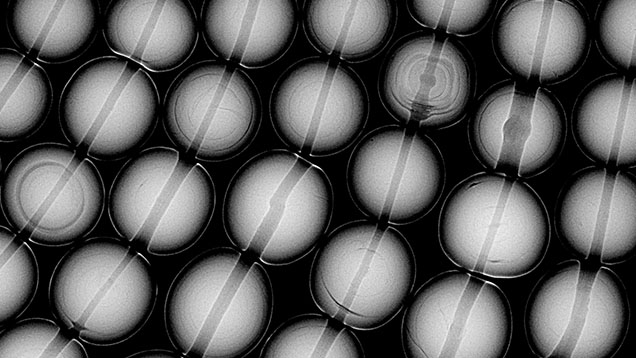
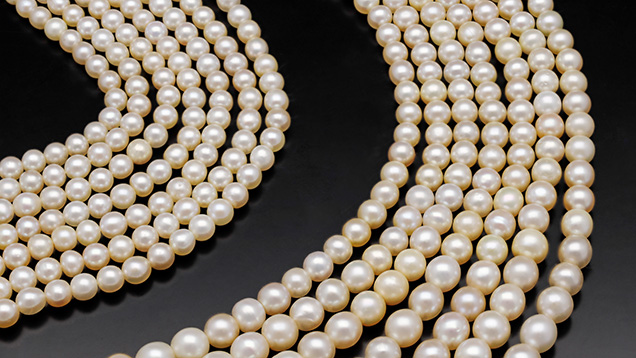
Examples of typical internal growth structures of natural pearls are seen in figure 9, which shows a section of a multi-strand necklace containing natural saltwater pearls formed by a Pinctada species mollusk. These structures include minimal growth arcs, concentric growth arcs, and some organic-rich light gray or dark gray cores. While these growth structures are relatively straightforward, it is important to note that natural pearls may exhibit additional growth patterns resembling those found in non-bead cultured pearls, such as linear, void, or evenly spaced growth rings in the center. Some structures fall into the borderline region between natural and non-bead cultured pearls, requiring additional information such as mollusk species, surface or age condition, and trace element chemistry to help with the identification.
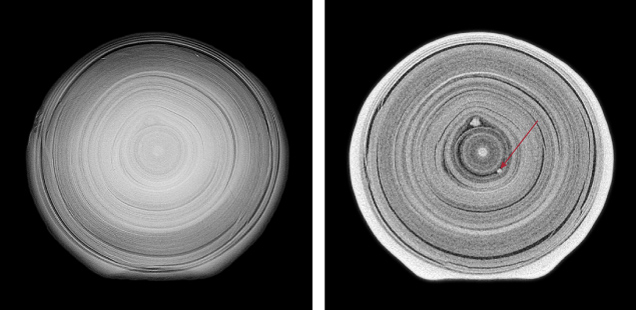
In addition to separating three major types of pearls, the X-ray radiographic technique can also be used in detecting other features or unusual culturing methods, such as silver nitrate treatment to darken the color (Segura and Fritsch, 2014), imitation products such as Majorica imitation pearls (Hanano et al., 1990), and pearls that have been filled or plugged internally (Wong and Ho, 2013). While 2D microradiographs are essential for the identification of pearls, they can only provide overall growth structural information. It is often necessary to examine pearls from different directions to better visualize growth patterns. An attempt to create “3D X-ray radiography” using a conventional radiographic system has also been made (Hainschwang, 2011). In recent years, μ-CT analysis has become more common and is often needed to conclude a pearl’s identity. High-resolution scans of a sample can reveal fine details of its growth structures, including fine linear structures or other small growth features that are otherwise difficult to observe. When the non-bead cultured pearl shown in figure 8C was subjected to μ-CT analysis, one of the images revealed additional “seed” features in its center, which supported the conclusion of a non-bead cultured pearl; compare figure 10 (right) to figure 10 (left). Conventionally, μ-CT analysis is limited to loose pearls or unobstructed mounted pearls, and it is relatively time-consuming to examine each pearl individually. However, recent advances make it possible to examine multiple pearls in a strand simultaneously using this technique (Rosc et al., 2016).
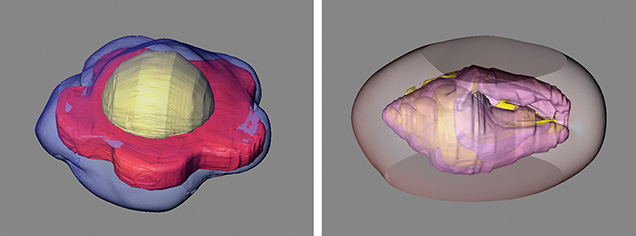
Another advantage of μ-CT is its ability to reconstruct a pearl’s internal structures into 3D models using specialized software. This provides better visualization of internal structures, especially for pearls that contain unusual nuclei. Pearls cultured using atypical materials, producing unique shapes and morphologies, are excellent examples of this use (figure 11) (Zhou et al., 2016; Scarratt et al., 2017; Yazawa and Zhou, 2018).
While these X-ray techniques undoubtedly play a critical role in the characterization of pearls, there are several limitations. Pearls mounted in jewelry are often blocked by a metal setting, which prevents X-rays from penetrating and reaching the target. Certain colored pearls such as Queen conch pearls are unstable under extended X-ray exposure, causing an unwanted discoloration of their pink color, which may impact their value (Hyatt et al., 2020). Moreover, the cost of a modern μ-CT unit and the time needed to acquire high-quality data may be prohibitive.
Finally, there have been novel techniques involving various X-ray imaging methods applied to pearl analysis in recent years, but these are not routinely used and fall beyond the scope of this article. These techniques include using simultaneous X-ray radiography, phase-contrast and darkfield imaging to separate natural from cultured pearls (Krzemnicki et al., 2017), and the attempt to use neutron radiography to investigate internal structures (Hanser et al., 2018; Micieli et al., 2018).
APPLICATIONS IN GEMSTONE TESTING AND MINERALOGY
μ-CT has a wide range of applications in gemology and mineralogy. Perhaps the most compelling use is documenting rare and unique samples in 3D. One recent example was the analysis of the Matryoshka diamond, a 0.62 ct green crystal with cavities and a freely moving inclusion within it. Wang et al. (2020) used μ-CT to observe how the morphology of the internal cavity related to that of the exterior diamond. This technology is well suited for examining an array of inclusions trapped within other minerals. Nimis et al. (2016) used μ-CT to study mineral inclusions in diamonds and found a very thin (<1 μm thick) layer of hydrosilicic fluid surrounding many of these inclusions. This layer appeared to have a lower density than the host diamond and the mineral inclusions. Linzmeyer et al. (2024) used μ-CT to image clouds of nickel-rich micro-inclusions captured along the cuboid growth sectors of two large diamonds. The individual inclusions were too small to be seen directly in the μ-CT reconstruction, but inclusion clouds provided a very subtle difference in X-ray absorbance that allowed for 3D imaging of the included growth sectors. Gao et al. (2022) used high-resolution μ-CT on an emerald with a special trapiche pattern containing a colorless core, solid minerals, and fluids to visualize the distribution of these inclusions within the gem host.
In the field of paleontology, μ-CT is widely used to image fossils. For example, Watanabe et al. (2015) studied the air-filled sacs in dinosaur vertebrae, which contributed to their respiratory system similarly to the bones of modern birds. Barta et al. (2018) studied the evolution of dinosaur hand anatomy. Fossils in amber were studied by Barden and Grimaldi (2012), who documented an ant with sharp tusk-like mandibles in 98-million-year-old amber from Myanmar.
X-ray radiography and μ-CT are powerful tools for detecting and analyzing fracture filling in gems such as diamonds, rubies, and sapphires. An X-ray radiograph of a 0.90 ct Yehuda-treated diamond showed the filled areas as opaque, unexposed white patches (Koivula et al., 1989). Jia and Sit (2020) used 2D X-ray imaging to visualize bismuth-glass filling in Burmese rubies. An unusual tin-glass filling in ruby was also reported in which X-ray radiography of the ruby revealed slightly lighter-appearing patchy areas corresponding to the location of the filler in surface-reaching fissures (Sun et al., 2023). Similarly, Sahoo et al. (2016) used 2D and 3D X-ray imaging to analyze the structure of lead glass–filled fractures in rubies. They coupled this method with electron microprobe analysis to determine the chemical composition of the filler. In addition, X-ray imaging techniques can be used to pinpoint filled laser drill holes in diamonds (Hainschwang, 2011) and even aid in the identification of ivory products (Karampelas and Kiefert, 2010). Finally, X-ray radiography can be a supplemental method in identifying composite gemstones such as the lead glass–filled corundum doublet reported by Promwongnan et al. (2016). A study on a range of gems using μ-CT analysis, focusing on fracture filling but also investigating any color change due to X-ray exposure, found that most of the gems recovered their original color with time. However, one sky blue topaz lost all color, and it did not return even after months (Heyn et al., 2021).
CONCLUSIONS
Both X-ray radiography and X-ray computed microtomography have a wide range of applications. In the field of gemology, these two techniques are commonly used to distinguish natural and cultured pearls, though they have also been used to characterize other gem materials. With the continuous development of pearl culturing methods and the complexity of natural pearl formation, these techniques will play a more critical role in the identification of these beautiful yet mysterious biogenic gemstones (figure 12). Although most cultured and natural pearls can be reliably separated with X-ray microradiography alone, their internal growth features are better visualized with μ-CT. In certain cases, high-resolution μ-CT is required to distinguish some natural and non-bead cultured pearls. While X-ray radiography and μ-CT are not generally used in the routine analysis of non-pearl gems, these methods could be more widely applied to study fracture filling in gems and to document and visualize the interiors of rare and interesting samples.
