Geographic Origin Determination of Blue Sapphire
Abstract
Geographic origin determination, one of the most pressing issues facing modern gemological laboratories, is especially challenging for blue sapphire. Reliable origin determination requires careful analysis of a stone’s inclusions and trace element chemistry as well as spectroscopic data. Some stones have characteristic inclusion scenes or trace element chemistry that make it easy to determine their origin, but in many cases there is significant overlap for blue sapphire from distinct geographic localities. The most commonly encountered inclusions are rutile silk and particle clouds. In some stones the silk or clouds may take on a distinct appearance and the origin may be accurately determined. But in many cases the evidence presented by inclusions within a stone is ambiguous. This contribution outlines the methods and criteria used at GIA for geographic origin determination of blue sapphire.
INTRODUCTION
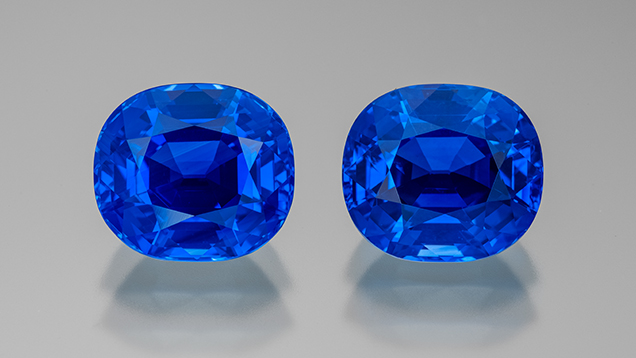
The twentieth century witnessed a surge of discoveries of blue sapphire deposits around the world. As the gem trade has evolved alongside these developments, geographic origin determination has become a major consideration in buying and selling sapphires. In some cases, the value of a stone can depend strongly on its origin, such as the Kashmir sapphires shown in figure 1. The trade largely relies on reputable gemological laboratories to make these origin determinations, which are based on comparison with extensive reference collections (see Vertriest et al., 2019, pp. 490–511 of this issue) and advanced analytical methods (see Groat et al., 2019, pp. 512–535 of this issue). After more than a decade of efforts by GIA’s field gemology and research departments to acquire reliable samples in the field and collect reference data, blue sapphire remains one of the greatest challenges when it comes to origin determination. The following sections will detail the origin data GIA has collected for blue sapphire and describe the laboratory’s methodology for using this data in geographic origin determination.
SAMPLES AND ANALYTICAL METHODS
The sapphires included in this study are almost exclusively from GIA’s reference collection, which was built over more than 10 years by GIA’s field gemology department. Stones in GIA’s reference collection were obtained by gemologists from reliable sources and collected as close to the mining source as possible (see Vertriest et al., 2019, pp. 490–511 of this issue). When necessary, the data from the reference collection were supplemented by stones from the personal collections of the authors of this study or from GIA’s museum collection. The trace element data were collected from 606 samples total for metamorphic sapphires and 342 samples total for basalt-related sapphires: 124 from Sri Lanka, 263 from Madagascar, 219 from Myanmar (formerly Burma), 72 from Nigeria, 67 from Australia, 72 from Thailand, 46 from Cambodia, and 85 from Ethiopia. In modern times it has not been possible to collect Kashmir sapphires through the field gemology program. Therefore, data presented here for Kashmir sapphires are from observations on historic stones and collections with verifiable provenance or those that could be independently verified through multiple lines of evidence.
Trace element chemistry was collected at GIA over the course of several years using two different laser ablation–inductively coupled plasma–mass spectrometry (LA-ICP-MS) systems. The ICP-MS used was either a Thermo Fisher X-Series II or iCAP Qc system, coupled to an Elemental Scientific Lasers NWR 213 laser ablation system with a frequency-quintupled Nd:YAG laser (213 nm wavelength with 4 ns pulse width). Ablation was carried out with 55 μm spot sizes, with fluence of 8–10 J/cm2 and repetition rates of either 15 or 20 Hz. 27Al was used as an internal standard at 529250 ppmw with custom-developed synthetic corundum used as external standards (Wang et al., 2006; Stone-Sundberg et al., 2017). Detection limits varied slightly through the course of the analyses but were generally 0.1–0.3 ppma Mg, 0.5–2.0 ppma Ti, 0.03–0.2 ppma V, 5–20 ppma Fe, and 0.03–0.07 ppma Ga. Trace element values are reported here in parts per million on an atomic basis rather than the more typical parts per million by weight unit used for trace elements in many geochemical studies. Units of ppma are the standard used in GIA laboratories for corundum, as they allow a simpler analysis of crystal chemical properties and an understanding of the color mechanisms of sapphire and ruby. Conversion factors are determined by a simple formula that can be found in table 1 of Emmett et al. (2003). The reference samples represent a diverse assemblage of stones in terms of their appearance and the presence/absence of silk, clouds, and otherwise included areas. Every effort was made to sample as many chemically distinct areas in heterogeneous samples as possible to ensure robust representation of silky, cloudy, and unincluded sapphire trace element chemistry.
Inclusions were identified, when possible, using Raman spectroscopy with a Renishaw inVia Raman microscope system. The Raman spectra of the inclusions were excited by a Modu-Laser Stellar-REN Ar-ion laser producing highly polarized light at 514 nm and collected at a nominal resolution of 3 cm–1 in the 2000–200 cm–1 range. In many cases, the confocal capabilities of the Raman system allowed inclusions beneath the surface to be analyzed.
UV-Vis spectra were recorded with a Hitachi U-2910 spectrometer or a PerkinElmer Lambda 950 in the range of 190–1100 nm with a 1 nm spectral resolution and a scan speed of 400 nm/min. UV-Vis-NIR spectra are presented as absorption coefficient (a) in units of cm–1, where a = A × 2.303/t, with A = absorbance and t = path length in cm.
METAMORPHIC VS. BASALT-RELATED BLUE SAPPHIRE
Often the easiest approach in making a geographic origin determination is to simply exclude as many origins as possible, leaving only a few candidates for the final decision. Blue sapphire can be broadly separated into two groups based on geological conditions of formation, giving us “metamorphic” and “basalt-related” blue sapphire. Basalt-related blue sapphires are those that have been brought up from some unknown great depths in the earth as xenocrysts (foreign crystals) in volcanic eruptions of alkali basalts and related rocks. The sapphires themselves are presumed to have been in equilibrium with some other magma, which would have been distinct from the host basalts (e.g., Graham et al., 2008; Giuliani and Groat, 2019, pp. 464–489 of this issue). Classical sources such as Australia, Thailand, and Cambodia have produced these sapphires for more than 100 years, but basalt-related sapphires are also found in some important newly discovered sources such as Nigeria and Ethiopia. In contrast, metamorphic sapphires are the product of cataclysmic tectonic events in which the earth’s continents collided, forming massive mountainous terranes composed of high-grade metamorphic rocks in which the sapphires formed through solid-state recrystallization of preexisting rocks. There are many open questions about the exact geological conditions of formation in these deposits, but metamorphic sapphires are generally associated with marbles, gneisses, aluminous shales, or (in the case of Myanmar) syenite-like rocks associated with these high-grade metamorphic rocks (e.g., Stern et al., 2013; Giuliani et al., 2014). The classical sources of Sri Lanka, Myanmar, and Kashmir are included in the metamorphic sapphire group as well as the more modern source of Madagascar. Note that this work focuses on the methodology used to determine origin for classical metamorphic sapphires from Sri Lanka, Burma, Kashmir, and Madagascar, as well as basalt-related sapphires from Australia, Thailand, Cambodia, Nigeria, and Ethiopia. These sapphires represent the biggest challenges for origin determination. Origin determination is generally more straightforward for “non-classical” sapphire deposits such as those from Montana (United States) and Umba and Songea in Tanzania. These “non-classical” sapphires are not considered here for the sake of clarity and brevity.

While the metamorphic/basalt-related dichotomy may be oversimplifying what is almost certainly an extremely complex geological story (Giuliani and Groat, 2019, pp. 464–489 of this issue), making this distinction on an unknown sapphire can help narrow down the possible origins. Metamorphic and basalt-related blue sapphires tend to have different trace element profiles. Notably, metamorphic blue sapphires generally have lower Fe and Ga than basalt-related sapphires, which in some cases can be used to separate stones from these two groups. However, there is some overlap and the two groups cannot be completely separated (figure 2). Coarse separation is simplified using ultraviolet/visible/near-infrared (UV-Vis-NIR) spectroscopy. Figure 3 compares the UV-Vis-NIR spectrum of a metamorphic sapphire from Sri Lanka against that of a basalt-related sapphire from Australia. The spectra of the two samples share many similarities, including a broad absorption band at 580 nm (the Fe-Ti intervalence charge transfer band) and a series of narrow bands around 380–390 nm and 450 nm related to Fe3+ (Ferguson and Fielding, 1971; Krebs and Maisch, 1971; Hughes et al., 2017). The major difference is the presence of a broad band around 880 nm in basalt-related sapphires, which is always more intense than the 580 nm absorption band. The exact origin of the 880 nm band is still not well understood, although it is thought to be related to an Fe2+-Fe3+ intervalence charge transfer mechanism, possibly with the involvement of Fe2+-Fe3+-Ti4+ clusters (Townsend, 1968; Fritsch and Rossman, 1988; Moon and Philips, 1994; Hughes et al., 2017). Obtaining a UV-Vis-NIR absorption spectrum is GIA’s first step in geographic origin determination of sapphires, as it directs the unknown stone into one of two separate decision-making streams, each with its own unique set of reference data accumulated over more than a decade by GIA’s field gemology program (Vertriest et al., 2019, pp. 490–511 of this issue). Note that there are reported instances of sapphires with metamorphic-type UV-Vis spectra altering to basalt-related-type UV-Vis spectra after heat treatment (e.g., figure 20 of Emmett and Douthit, 1993). However, this is considered uncommon based on years of experience of testing heated sapphires that can be clearly identified as metamorphic by microscopic observation. Additionally, trace element analysis can allow separation of most heated metamorphic sapphires that start down the wrong decision stream based on their UV-Vis spectra.

INTERNAL FEATURES: METAMORPHIC SAPPHIRES
Metamorphic blue sapphire poses one of the biggest challenges in geographic origin determination. A hundred years ago it was much less of a problem, when the only major sources of these sapphires were Kashmir, Myanmar, and Sri Lanka. At that time, these sapphires were thought to have more or less diagnostic appearances and inclusion suites. A significant obstacle to metamorphic sapphire origin determination came about in the last 25 years, when Madagascar started producing large volumes of sapphires that could overlap with any of the three classical metamorphic sources (Kiefert et al., 1996; Schwarz et al., 1996; Gübelin and Peretti, 1997; Schwarz et al., 2000). Even without the arrival of Madagascar sapphires, it is not always possible to separate the three classical sources with 100% confidence. Adding further to the complication is the discovery in modern times of new mining sites within a single country, such as at Kataragama in Sri Lanka in 2012. The situation is all the more perilous given the dramatic difference in value between these origins: A fine, classical Kashmir sapphire (figure 4) can be sold for many times more than a Madagascar sapphire of exceptional quality and size (figure 5). In these circumstances, determining the geographic origin of metamorphic sapphires requires the utmost care and deliberation.


Typical Inclusion Scenes. For metamorphic blue sapphire, evidence of geographic origin largely comes from careful microscopic observations of inclusions. While certain mineral inclusions are sometimes considered diagnostic, such as tourmaline crystals in Kashmir sapphires, such inclusions are rare. For the most part, inclusion evidence comes in the form of the overall appearance of silk and clouds in metamorphic blue sapphire. While these more common inclusions may help to identify geographic origin, they should be used as supporting evidence in addition to chemical analysis as these features often overlap significantly. We will review the typical inclusion scenes expected for sapphires from Sri Lanka, Myanmar, Madagascar, and Kashmir. Additional reading on inclusions in metamorphic sapphires can be found in Atkinson and Kothavala (1983), Hänni (1990), Schwieger (1990), Kiefert et al. (1996), Schwarz et al. (1996), Gübelin and Peretti (1997), Schwarz et al. (2000), Gübelin and Koivula (2008), Kan-Nyunt et al. (2013), Krzemnicki (2013), Hughes et al. (2017), and Atikarnsakul et al. (2018).
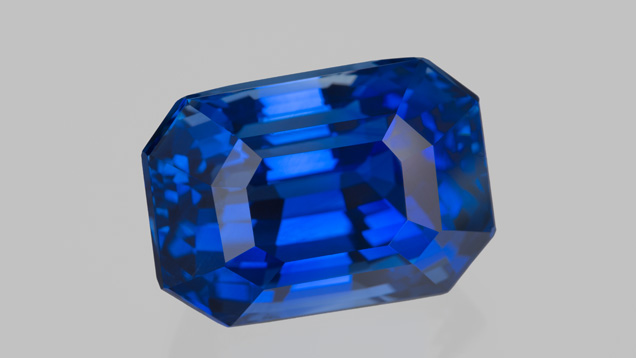
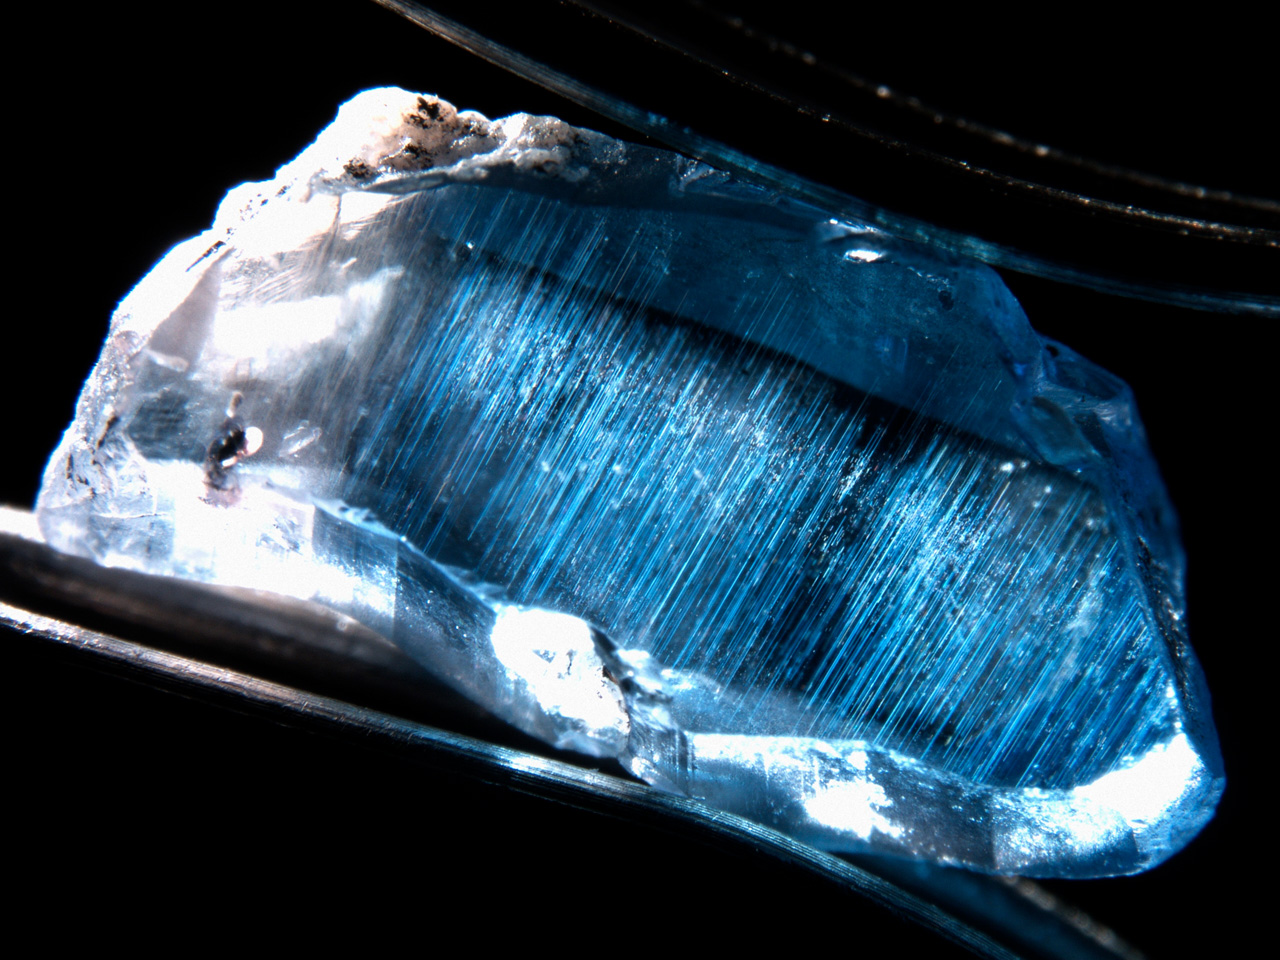
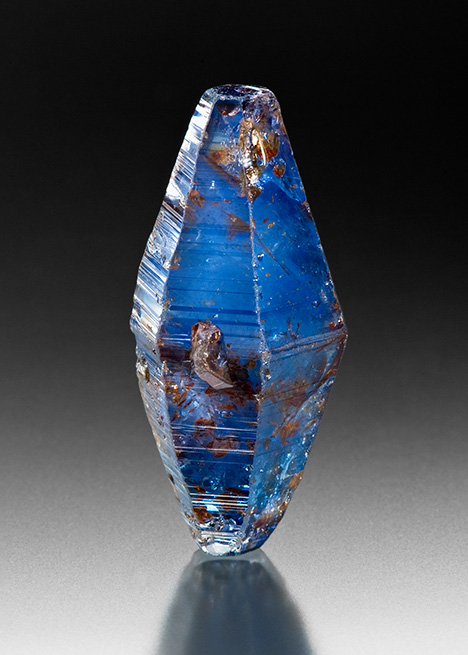
The Internal World of Sri Lankan Sapphires. Sri Lanka has been an important source of fine-quality blue sapphire (figure 6) for many millennia, throughout much of recorded human history. Cut stones are often fashioned from rough sapphires that formed as bipyramidal crystals (figure 7, facing page). Several photomicrographs depicting typical inclusions in Sri Lankan sapphires are shown in figures 8–12. The hallmark inclusion characteristic of Sri Lankan sapphires is long, slender rutile needles (figure 8). In Sri Lankan sapphire this long rutile silk is often relatively sparsely and evenly distributed, with single needles displaying exceptional continuity, sometimes traversing an entire stone. However, silk in Sri Lankan sapphires can also occur as thin, irregular platelets (figure 9) or as more densely packed particle clouds composed of typically shorter needles, but these are not necessarily suggestive of a Sri Lankan origin. Rectilinear, partially healed fractures are more common in Sri Lankan sapphires than in sapphires from other sources (figure 10). These zigzag fingerprints are considered more indicative of a Sri Lankan origin, and their observation may influence geographic origin conclusion. The same is true for CO2-filled negative crystals, which are found in metamorphic sapphires from many localities but are frequently associated with Sri Lanka in the minds of many gemologists and could give an initial impression of that origin (figure 11). Sri Lankan sapphires often have these negative crystals arranged in fingerprint-like planes. Similarly, green gahnospinel was once thought to be diagnostic of Sri Lankan sapphires. Although green spinel has now been seen in metamorphic sapphires from other deposits, it is still suggestive of Sri Lankan origin (figure 12). Unfortunately, green gahnospinels are rare inclusions. Pyrite inclusions, often in dark, round ball-like crystals, are also more common in Sri Lankan stones than from other deposits and can also be considered suggestive of Sri Lankan origin, but not definitive proof. Other mineral inclusions sometimes seen in Sri Lankan sapphire are mica, uraninite, calcite, and zircon. However, such mineral inclusions are also found in sapphires from other deposits and are not considered characteristic of a Sri Lankan origin. Sri Lankan sapphires often show color zoning as straight, alternating bands of blue and colorless zones, usually with sharp boundaries.
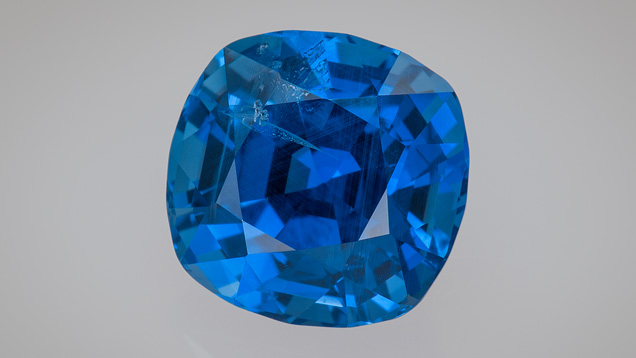
The Internal World of Burmese Sapphires. Myanmar is another classical source of sapphires. The stones produced from the Mogok Stone Tract sometimes have an ill-gained reputation for being overly dark, while in reality Myanmar has produced many exceptional stones with vivid and bright blue hues that rival the colors of stones from the other classical sources (figures 13 and 14). While Sri Lankan sapphires have long, slender silk, Burmese sapphires are considered to be characterized by shorter, reflective rutile silk, sometimes occurring in an arrowhead pattern (figure 15). Note that despite these general differences, there is significant overlap in the nature of silk patterns in stones from Sri Lanka, Myanmar, and other sources. Additionally, many stones have silk or other inclusions that do not appear to be characteristic of any deposits. What follows is a description of the generally accepted characteristics of Burmese silk and other internal features.
The silk in Burmese sapphires can be densely packed in somewhat discrete bands (figures 16 and 17), and many Burmese sapphires have a mix of short and long silk (figure 18). Often the silk has a straw-like nested pattern in which the lattice of silk is closely intergrown with itself (figure 19), although care may be needed to distinguish such an inclusion scene from the long silk sometimes seen in Sri Lankan sapphires. Rutile silk in Burmese sapphires tends to have a somewhat flattened aspect. The result is often wild displays of spectral colors due to a thin-film effect when using intense fiber-optic illumination from just the right angle (figures 15 and 17). Twinning is commonly observed in Burmese sapphires, especially with intersecting tubules sometimes filled with diaspore or other aluminum (oxy)hydroxides, and can be used as evidence supporting an origin determination (figure 20). Burmese sapphires typically have uniform color. When observed, color zoning is diffuse or “fuzzy,” without the sharp boundaries seen in metamorphic sapphires from other deposits (figure 21). Mineral inclusions sometimes encountered in Burmese sapphires include calcite, mica, and zircon, although none of these are considered characteristic of a Burmese origin.

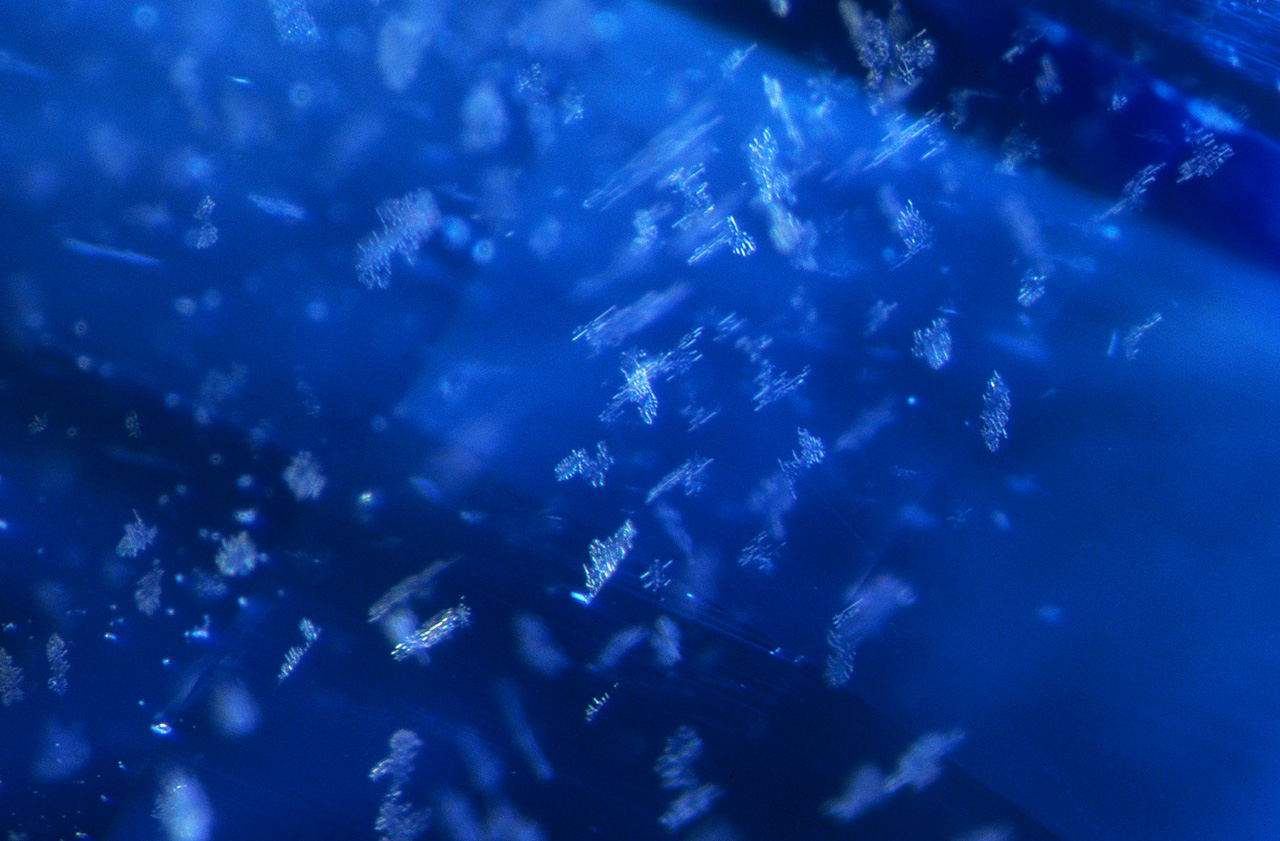
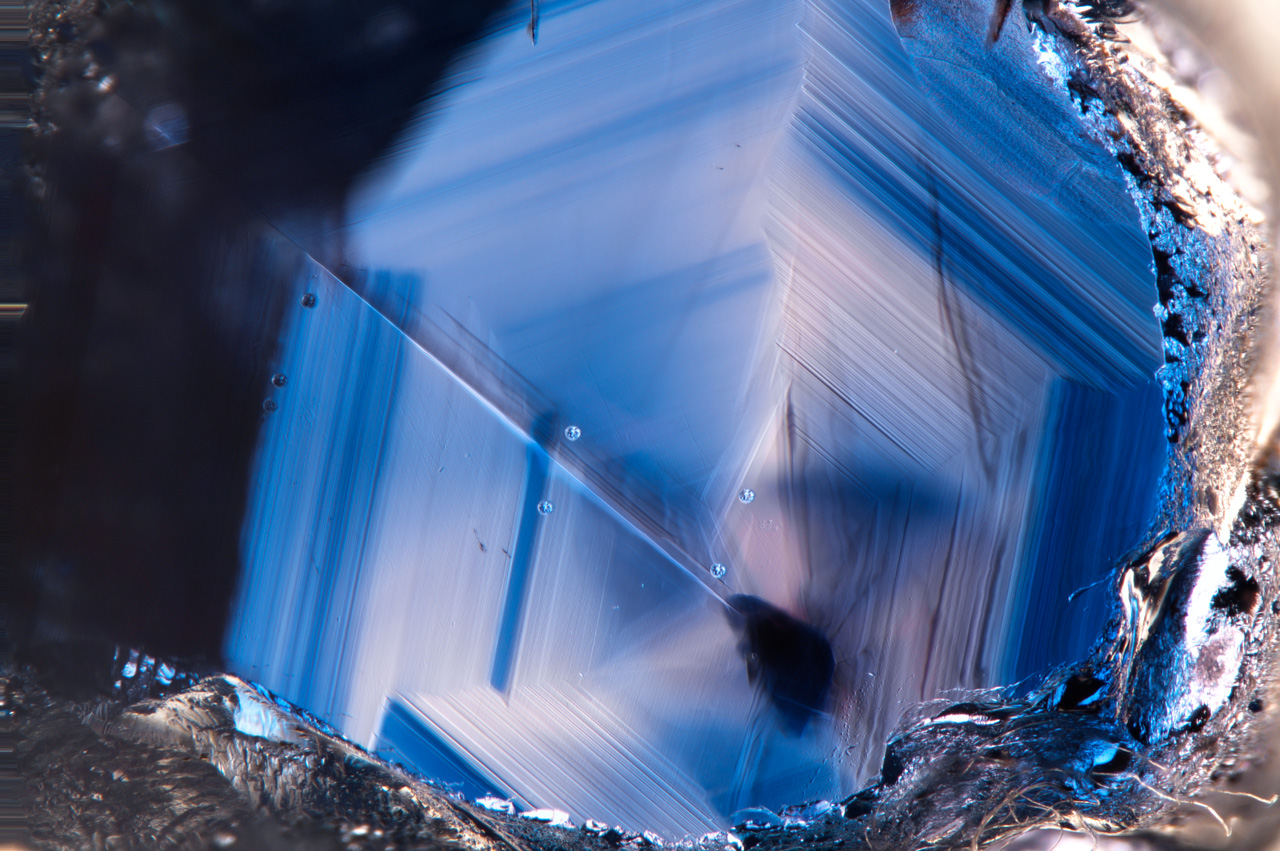
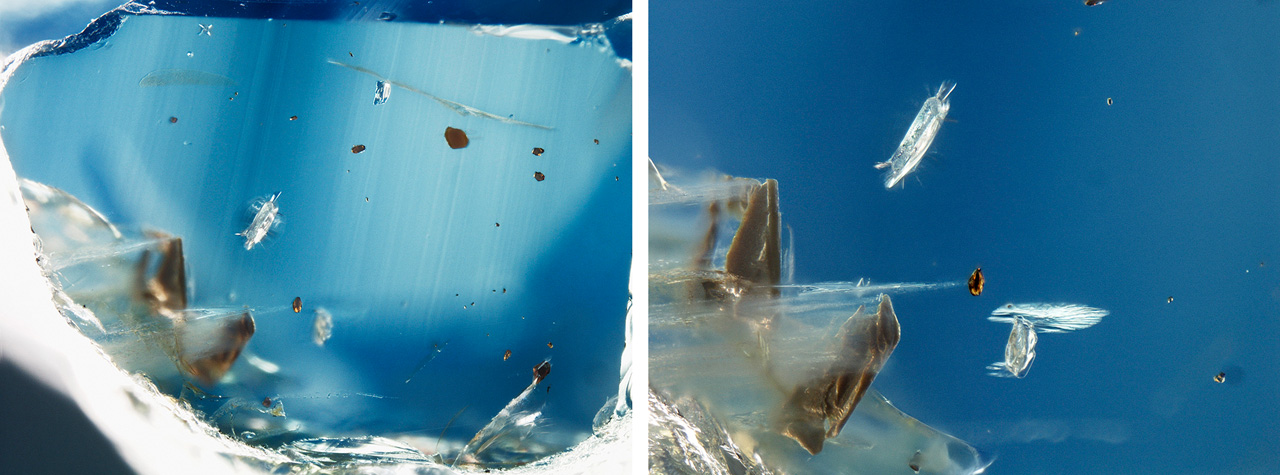
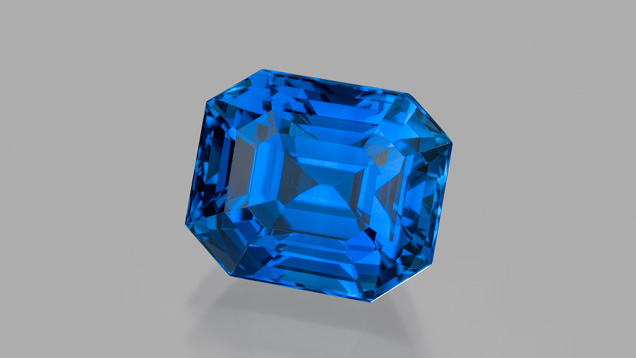
The Internal World of Kashmir Sapphires. The most highly sought-after sapphires are those bearing a Kashmir pedigree. Classical Kashmir sapphires (figures 22 and 23) often harbor characteristic inclusions that can be helpful in identifying them. It is widely known that Kashmir sapphires may also contain certain diagnostic mineral inclusions that can conclusively determine their origin. For instance, inclusions of tourmaline, pargasite (or hornblende), and elongate but often corroded zircon can generally be taken as evidence of a Kashmir provenance (figures 24–26). Unfortunately, such mineral inclusions are somewhat rare in fine Kashmir stones. What is left to decipher a Kashmir sapphire’s origin, then, is often the same as with other sapphires: patterns of silk and particle clouds of varying textures. In particular, features often referred to as “patterned clouds” can be especially helpful with Kashmir sapphires (figures 27–30). Patterned clouds include so-called ladder, snowflake, and wavy stringer-like inclusions. Other helpful indicators of a Kashmir origin are dense, milky clouds arranged in well-defined hexagonal patterns. The term “milky” is used to describe clouds composed of submicroscopic particles that scatter light but cannot be resolved as individual particles in a microscope. These milky clouds often have what is described as a “blocky” pattern where the intersection of hexagonal bands occurs in a somewhat step-like pattern (figure 31). These milky bands are the cause of the sleepy, velvety texture so admired in fine Kashmir sapphires. Uraninite mineral inclusions are sometimes found in Kashmir sapphires but are not considered characteristic, as they are also found in stones from other deposits.
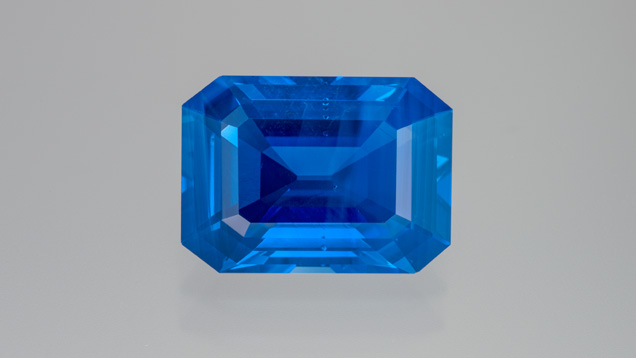
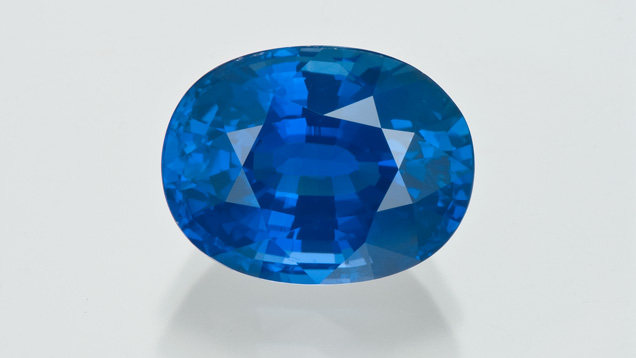
The Internal World of Madagascar Sapphires. Madagascar produces metamorphic sapphires (figure 32) from several geographically distinct deposits. Additionally, some of the mining areas such as Ilakaka are expansive secondary deposits in which the sapphires were likely derived from several distinct geological formations. For these reasons, Madagascar produces sapphires with a wider range of properties and inclusions than anywhere else. Moreover, the end result of this gemological diversity is that Madagascar sapphires can overlap (sometimes significantly) with metamorphic sapphires from all other major sources. Nonetheless, some inclusion scenes are considered more characteristic of Madagascar sapphires and can be used to identify this origin. For instance, pronounced milky banding (figures 33 and 34) can often indicate a Madagascar origin. Milky clouds with unusual or chaotic geometric patterns, often occurring in finely repeating layers as so-called stacked milky clouds, can also suggest a sapphire was mined in Madagascar (figure 35). A highly experienced eye is sometimes needed to distinguish hexagonal milky bands in Kashmir sapphire from those seen in a small subset of Kashmir-like sapphires from Madagascar. In Kashmir sapphires, the intersection of these bands often has a stepped pattern (figure 31), while in Madagascar their intersection is often more irregular and chaotic (figure 34). Strong graining and intense color zoning, sometimes with a chaotic or irregular (but still geometric) pattern are occasionally seen (figure 36). Note as well that many Madagascar sapphires have clouds that appear milky in low magnification, but individual particles may become discernible at higher magnification in a gemological microscope (e.g., about 40× magnification). Such clouds should be called “particulate” clouds and not “milky” clouds. These are distinct from the classical Kashmir-like milky clouds. Finally, while etch tubes are found in nearly all metamorphic sapphires, they tend to be more common in Madagascar stones (figure 37) and, taken together with other evidence, may lead to a geographic origin conclusion of Madagascar. Mineral inclusions sometimes found in Madagascar sapphires include calcite, uraninite, zircon, and mica, although none of these can be considered characteristic of a Madagascar origin, as they are found in sapphires from many of the metamorphic deposits.
Inclusion Scenes Gone Wrong. How would one determine the origin of a stone with the inclusion scene in figure 38? The dense, finely alternating milky clouds might give the initial impression of a Madagascar origin, but Kashmir cannot be ruled out. Milky clouds in Kashmir stones often have a blocky pattern in which the intersection of hexagonal bands occurs in a step-like pattern. However, this Kashmir sapphire shows only one set of these milky bands, precluding observation of this useful information. This brings up the challenge often faced in geographic origin determination. In every case we attempt to collect as many lines of evidence as possible to support an origin determination. If enough individual pieces of evidence point toward a specific origin, we can become more confident in making that call. In some cases, however, diagnostic inclusions are not observed in a certain stone, leaving only inclusions that are ambiguous due to overlapping inclusion characteristics between deposits.
For instance, the inclusions of two Sri Lankan sapphires in figures 39–42 show milky banding and/or hexagonal color banding that might initially be more suggestive of a Madagascar origin. If no other indicative inclusions are found, these stones could easily be victims of mistaken identity, with their Sri Lankan origin hidden away forever. Additional examples of Sri Lankan stones with potentially Madagascar-like inclusions such as pronounced milky clouds, strong graining, and angular, irregular color zoning are shown in figures 43 and 44.
By contrast, the longer, slender rutile silk in figures 45 and 46 might be taken as more suggestive of a Sri Lankan provenance, obscuring the true Madagascar origin of these sapphires. Additionally, the rectilinear zigzag, partially healed fracture in figure 47 and the CO2-filled negative crystal in figure 48 might lead to an incorrect conclusion of Sri Lankan origin for these sapphires, which have a known Madagascar or Burmese provenance, respectively. As mentioned above, Madagascar sapphires can sometimes harbor inclusion scenes that imitate almost any other source of metamorphic sapphires. The twinning and short, stubby reflective needles and arrowhead silk found in Madagascar sapphires shown in figures 49–51 might otherwise indicate a Burmese origin. Kashmir origin became especially troublesome in the lab once Madagascar sapphires were found with Kashmir-like features such as the patterned clouds shown in figures 52–54. Madagascar sapphires may also occasionally contain slightly elongate zircon inclusions, giving at least an initial impression of a Kashmir inclusion scene (figure 55). While the patterned clouds in Madagascar sapphires may have a different overall appearance than those found in Kashmir sapphires, there is enough potential overlap, especially on first examination, that these stones must be intensely scrutinized in the lab.
Burmese sapphires may go unrecognized on occasion when their inclusions are especially reminiscent of Madagascar or Sri Lankan sapphires (figures 56 and 57). However, sometimes the situation is not so dire. The Burmese sapphire in figure 57 may appear Sri Lankan at first glance with its long, slender, and loosely packed rutile silk. However, closer examination and the use of an intense fiber-optic light show reflective and shorter rutile needles and arrowhead silk, which are more suggestive of the stone’s true Burmese origins.
INCLUSION SCENES IN BASALT-RELATED BLUE SAPPHIRE
If the UV-Vis-NIR spectrum of a blue sapphire shows a prominent absorption band at 880 nm, the stone is determined to be a basalt-related sapphire and an entirely different suite of origins are possible. At present, the main sources of gem-quality basalt-related sapphires that come through the lab include Australia, Thailand, Cambodia, Nigeria, and Ethiopia. Of course, there are other deposits where basalt-related blue sapphires are actively mined or have been in the recent past, including Cameroon, Laos, Vietnam, northern Madagascar, and China. However, these are expected to be less economically important in the global gem trade. While these stones are represented in GIA’s reference collection and these sources can be considered for an origin call, there is a low probability of seeing them in a gemological laboratory, and their gemological properties will not be considered further here. The approach to geographic origin determination for basalt-related sapphires is slightly different than for metamorphic sapphires. Specifically, trace element chemistry tends to take on greater importance in making origin conclusions. Inclusion characteristics are still considered, but there tends to be far more overlap and similarities in inclusion scenes for basalt-related sapphires from various localities. However, the various sources of basalt-related stones do tend to have more distinct trace element profiles, allowing for successful origin determination in many cases. Nonetheless, there is still considerable overlap, and origin determination for basalt-related sapphires can be more challenging than for metamorphic sapphires. Additional information about the inclusion scenes in basalt-related sapphires can be found in Gunawardene and Chawla (1984), Sutherland et al. (2009), Sutherland and Abduriyim (2009), and Abduriyim et al. (2012).
Basalt-related sapphires from the classical mining area of Pailin, Cambodia, often have somewhat diagnostic inclusions. They typically have thick, dense bands of milky clouds arranged in hexagonal patterns (figure 58), reminiscent of those seen in Kashmir sapphires. The best Cambodian sapphires can resemble stones from Kashmir, with a similar sleepy and velvety appearance due to the presence of dense milky bands. In fact, the color of fine Cambodian stones can often be used as an indicator of origin on its own, as most other basalt-related sapphires take on a much darker blue color in contrast to the often bright, vivid, and saturated blues of Cambodian stones. Pyrochlore inclusions can also be helpful in identifying Cambodian sapphires. While pyrochlore can be found in basalt-related sapphires from many other deposits, the pyrochlore in Cambodian stones tends to take on a deeper red color (figure 59) rather than the more brownish orange color seen in stones from other deposits (figures 60–62).
However, these pyrochlore inclusions are not found in every Cambodian sapphire, so one is often left to observe various patterns of silk and milky clouds to ascertain provenance. Unfortunately, dense milky banding can also be seen in sapphires from most other basalt-related sapphire deposits (figures 63 and 64). The one (near) exception to this are the sapphires found right across the border from Pailin in Chanthaburi, Thailand. The Thai sapphires very rarely show milky banding, and when it is present the milky clouds tend to be more coarsely particulate in nature. More common in Thai sapphires are dense accumulations of coarse, short to long silk needles (figure 65). The coarse silk in Thai sapphires often occurs in discrete geometric patterns constrained by corundum’s trigonal crystal lattice. Unfortunately, while coarser silk may be consistent with a Thai origin, this type of inclusion is also seen in sapphires from other basalt-related deposits such as Australia (figure 66) and Ethiopia (figure 67). The newly discovered deposit in Ethiopia actually represents one of the major difficulties with origin determination. While some inclusions that suggest an Ethiopian origin, such as clusters of zircons (figure 68) or multiple intersecting twinned sectors (figure 69), the more common inclusions overlap with those from other deposits. As the number of possible deposits grows, so does the overlap between these deposits.
THE CHALLENGE OF ORIGIN DETERMINATION FOR HEATED BLUE SAPPHIRE
The foregoing discussion has demonstrated the difficulty of using common inclusions in blue sapphire to make origin determinations due to overlap in their internal characteristics. For the most part, the data presented are applicable only to unheated stones. An additional complicating factor is that most blue sapphires on the market have been heated—either to deepen the color of metamorphic sapphires or sometimes to lighten the color of overly dark basalt-related stones. The problem lies in the fact that deepening the blue color essentially destroys rutile silk, which in many stones is the only internal feature that can be used to support a geographic origin determination (figure 70). As the rutile inclusions dissolve, Ti internally diffuses into the corundum lattice, producing Fe-Ti pairs and, hence, blue coloration. Angular blue streaks inside the stone are all that remains of the silk. For this reason, geographic origin conclusions can be challenging, if not impossible, in heated blue sapphire. While the situation is complicated enough for unheated stones, extra caution and care must be applied when attempting to identify the origin of heat-treated blue sapphire.

TRACE ELEMENT CHEMISTRY OF METAMORPHIC SAPPHIRES
Given the potential for overlapping properties for metamorphic sapphires from the major geographic deposits, reliable origin determinations can only come from consideration of multiple lines of evidence. Only when all available data are consistent with a single origin can the gemologist be satisfied with a geographic origin determination. While the origin of metamorphic blue sapphire is determined predominantly by inclusion scenes, trace element chemistry can play a supporting role and help increase confidence in an origin conclusion. Unfortunately, for metamorphic blue sapphires trace element chemistry is often of limited use. The problem is of a crystallographic nature. The physical properties that make corundum such a desirable gem material (high hardness and brilliance) are determined by its unique arrangement of aluminum and oxygen atoms. Unfortunately, corundum’s crystal lattice is incredibly unforgiving when it comes to accepting foreign atoms into its structure. The result is that only a handful of trace elements are ever routinely found in sapphires and rubies, typically at very low concentrations. This list includes Mg, Ti, V, Cr, Fe, and Ga. Therefore, there is an extremely narrow range in trace element chemistry for sapphires from similar geological environments.

The reality of the situation is illustrated by the trace element plots shown in figure 71, from GIA’s reference data for metamorphic blue sapphire. (Note that all trace element data are produced from LA-ICP-MS and reported in atomic parts per million; see Groat et al., 2019, pp. 512–535 of this issue.) The most striking aspect of these plots is the overwhelming amount of data included, representing nearly 10 years of unparalleled efforts in GIA’s field gemology and research departments (the data are summarized in table 1). Also worth noting is the high degree of overlap in much of the data for the major metamorphic blue sapphire deposits. There are clearly some areas in the plots that are uniquely occupied by sapphires from a specific origin such as some low-vanadium Burmese sapphires, some low-iron Sri Lankan stones, or Madagascar samples with low gallium and/or magnesium. However, most of the data occurs in a significantly overlapping field, and these plots clearly have limited value in origin determination. Also note that only three countries of origin are considered on these plots: Myanmar, Madagascar, and Sri Lanka. These chemical plots are also used for possible Kashmir stones and those from minor localities when appropriate, but in most cases these additional deposits are omitted from the plots in order to simplify the decision-making process. Typically, the sapphires are examined in the microscope before further advanced testing. If a stone has possible Kashmir inclusion features, the reference data for Kashmir sapphires can be added to the plots for comparison.

Part of the problem with these plots is their low dimensionality, as only two variables can be considered at one time and it is difficult to know if the overlap of certain data points on one plot could be cleared up by observing the same data on another plot. For instance, what if the Madagascar data that overlaps Sri Lanka on a Mg-Fe plot has much lower Ga than the specific Sri Lankan stones with overlapping Mg and Fe concentrations? This vast database would be much more useful if an unknown stone could be simultaneously compared against the entire trace element profile of the reference data. A new methodology used in the GIA laboratory involves taking the full trace element suite of an unknown stone and identifying only the reference data with similar chemistry. Then, the reference data with dissimilar chemistry are not shown in the plots. Not only does this mean the unknown is compared only against stones with similar chemistry, but it also clears up the plots by removing extraneous data, which greatly eases their use. Note that this method is essentially a variant of a well-established and widely used statistical classification procedure, the k-nearest neighbors technique (Cover and Hart, 1967; Dudani, 1976).
The mechanics of the method, which we call “selective plotting,” are relatively straightforward. Three LA-ICP-MS analyses are collected on each sample, and when the three spots are close in value they are averaged. Then a compositional “window” is created around the averages for each element (Mg, Ti, V, Fe, and Ga for corundum) and any reference data within this window will be preserved in the plots while any data outside the window for any of the trace elements are not shown on the plots. GIA uses three different levels for the windows: fine, medium, and coarse. These windows are centered on the average of the trace element compositions of the unknown stone and opened up at plus or minus 35%, 60%, and 85%, respectively, of the average composition for each element. This method is explained more carefully in box A, and an example is shown in figure 72 with the data for the unknown stone shown in table 2, which also illustrates the methodology by listing the upper and lower boundaries of the coarse, medium, and fine windows created for the trace element profile of an unknown sapphire. Note that the method also uses a fixed lower boundary to prevent the trace element windows from closing too much. In this case, the element V is affected by this lower boundary for the window, which is set at 4 ppma. Also note that prior experience has suggested that Cr is not an effective discriminant element for sapphire, so it is not used in any of the plots or involved in the selective plotting method. As the window is increasingly closed (figure 72), fewer data are shown in the plot and the data shown have chemistry closer to that of the unknown. Going from coarse to fine, Madagascar appears to be a much more likely origin, which was not at all obvious without the use of selective plotting.


Of course, selective plotting has its limitations as well. For one thing, it is obvious that some sapphires from different geographic localities have nearly identical trace element profiles. Several such examples are shown in table 3 (see p. 561). Clearly there is no novel methodology or sophisticated statistical analysis that can separate stones with virtually identical trace element profiles. While selective plotting does help in many cases to get an indication of origin from trace element chemistry, in other cases the overlap is simply too great (figure 73). As always, if trace element chemistry is ambiguous and there is no definitive evidence from the inclusion scene, a gemological laboratory is obligated to issue a finding of “inconclusive” origin. Nonetheless, the selective plotting method has been blind tested in the laboratory at GIA on samples with known provenance collected through GIA’s field gemology program. While the origin conclusions for the stones tested do not take into account inclusion evidence, in the cases when the selective plotting method does indicate a specific origin, the correct origin is assigned with a high level of accuracy using only trace element data and the selective plotting method.


TRACE ELEMENT CHEMISTRY OF BASALT-RELATED SAPPHIRE
While inclusions are not as useful for origin determination of basalt-related sapphires, trace element chemistry often plays a greater role (see table 4 for a summary of trace element data). GIA uses the same selective plotting technique as described above for metamorphic blue sapphire. An example of this method is shown in figure 74. (Note that all trace element data are produced from LA-ICP-MS; see Groat et al., 2019, pp. 512–535 of this issue.) The selective plotting method does seem to produce significantly more accurate origin determinations for basalt-related blue sapphire than for metamorphic blue sapphires. As with most geographic origin determinations, however, there will almost always be overlap, and in many cases the trace element chemistry evidence is ambiguous (figure 75). For basalt-related blue sapphires, ambiguous trace element data typically lead to an “inconclusive” origin call because of the often indistinct nature of their inclusions.


CONCLUSIONS
After more than 10 years, GIA’s field gemology and research departments have produced an enormous amount of data on the gemological properties of blue sapphire from major deposits around the world. Despite these efforts, the inescapable conclusion seems to be that there is often significant overlap between stones from distinct geographic localities, which makes it difficult—if not impossible in some cases—to make origin determination for every blue sapphire. Inclusions and trace element chemistry can be helpful in some cases. Some blue sapphires have diagnostic mineral inclusions or distinctive patterns of silk that help trace the stone to a specific geographic locale. Especially for the metamorphic blue sapphires, stones from Sri Lanka (figure 76), Myanmar, Kashmir, or Madagascar often have characteristic inclusions that allow conclusive origin determination. Many of the criteria used to reach a conclusion on a gem’s origin have come from years of experience of senior gemologists looking at stones. Our confidence in making many of these origin determinations stems from observation of reference stones collected by GIA’s field gemology department that have corroborated the criteria developed over many years. For basalt-related sapphires especially, comparison with reliable trace element chemistry from field gemology reference samples may show that a stone matches with only one possible mining site, confirming its origin. But many stones—especially high-end stones, which tend to be very clean—may have ambiguo us inclusion scenes or so few inclusions as to hinder origin determination. Or a stone’s trace element profile may closely match reference data from two or more distinct geographic localities. While geographic origin determination for blue sapphire will remain a major focus of further research at GIA in order to refine and improve our methods, clearly no amount of additional data or collection of more reliable samples will resolve some of these cases where the overlap in data precludes an origin determination.


