Update on Spectroscopy of “Gold Sheen” Sapphires

Sapphires displaying a golden sheen, known in the trade as “gold sheen” or “Zawadi” sapphires, entered the gem market in late 2009. These sapphires are mined in eastern Kenya (T.N. Bui et al., “From exsolution to ‘gold sheen’: A new variety of corundum,” Journal of Gemmology, Vol. 34, No. 8, 2015, pp. 678–691). They contain dense needles and platelets of hematite/ilmenite inclusions, which are responsible for producing a golden shimmer on the surface.
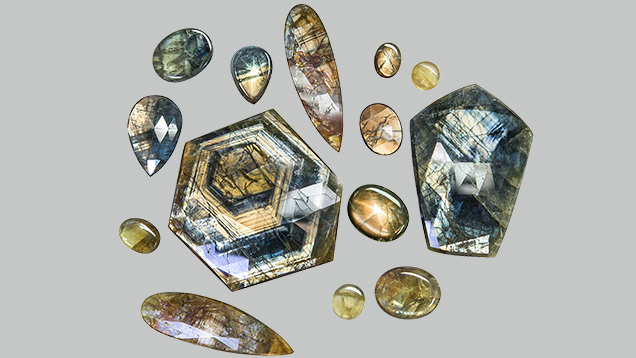
Recently, GIA’s laboratory in Bangkok received 14 gold sheen sapphires of various shapes and cuts. The samples had yellow and green to blue bodycolor, were transparent to translucent, and weighed 1.06 to 97.69 ct (figure 1). Their physical properties and inclusions were similar to those of gold sheen sapphires described in Bui et al. (2015): an RI of 1.762–1.772, a birefringence of 0.008–0.009, a hydrostatic SG of 3.98–4.01, an inert reaction to long- and short-wave UV radiation, and an abundance of hematite/ilmenite platelets. Since the samples had some transparent windows, UV-Vis-NIR spectra were analyzed.
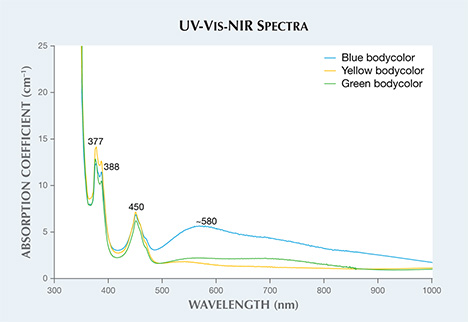
The UV-Vis-NIR spectra all displayed strong Fe-related absorption features at 377, 388, and 450 nm. Samples with a yellow bodycolor showed mainly the three Fe features, whereas the green to blue sapphires revealed a band centered at around 580 nm that is related to Fe2+-Ti4+ intervalence charge transfer, in addition to the three strong Fe features (figure 2). LA-ICP-MS analysis on inclusion-free areas showed high Fe ranging from 2550 to 3260 ppma, 2 to 8 ppma Mg, 4 to 11 ppma Ti, 30 to 45 ppma Ga, and 0.2 to 0.7 ppma V. For the green to blue samples, Ga/Mg overlapped, varying from 5 to 30. Samples with a yellow bodycolor varied from 4 to 11. Other trace elements including Zr, Nb, Ta, W, Th, and U were also detected but in insignificant quantities. It is notable that Mg and Ti concentrations were comparable in the yellow samples (all Ti4+ charges compensate Mg2+, leaving no Ti4+ to interact with Fe2+), whereas Ti concentrations were significantly higher than Mg concentrations in the green to blue sapphires resulting in some Ti4+ forming Fe2+-Ti4+ pairs (J.L. Emmett et al., “Beryllium diffusion of ruby and sapphire,” Summer 2003 G&G, pp. 84–135). The chemical and UV-Vis-NIR spectroscopic features corresponded with the bodycolors of these sapphires. In addition, FTIR spectra of the gold sheen sapphires generally showed diagnostic features of AlO(OH), consistent with either boehmite or diaspore; kaolinite; and gibbsite.


