Color-Change Glass as a Zultanite Imitation
Diaspore, a relatively common mineral with the chemical formula AlO(OH), is found in metamorphic bauxite deposits (A.A. Calagari and A. Abedini, “Geochemical investigations on Permo-Triassic bauxite horizon at Kanisheeteh, east of Bukan, West-Azarbaidjan, Iran,” Journal of Geochemical Exploration, Vol. 94, No. 1, 2007, pp. 1–18), and usually appears as a mineral inclusion in sapphire, ruby, and spinel (V. Pardieu, “Hunting for ‘Jedi’ spinel,” Spring 2014 G&G, pp. 46–57; Spring 2016 GNI, pp. 98–100; Summer 2016 GNI, pp. 209–211). However, gem-quality transparent diaspore is rare and appears to be unique to the Ilbir Mountains area in southwest Turkey (M. Hatipoglu et al., “Gem-quality transparent diaspore (zultanite) in bauxite deposits of the Ilbir Mountains, Menderes Massif, SW Turkey,” Mineralium Deposita, Vol. 45, No. 2, 2010, pp. 201–205). Zultanite is the trade name of diaspore that exhibits a color-change effect; the material appears yellow, pink, or green in different light sources. Zultanite has only been found in the Anatolian Mountains of Turkey (M. Hatipoglu and M. Akgun, “Zultanite, or colour-change diaspore from the Milas (Mugla) region, Turkey,” Australian Gemmologist, Vol. 23, 2009, pp. 558–562).
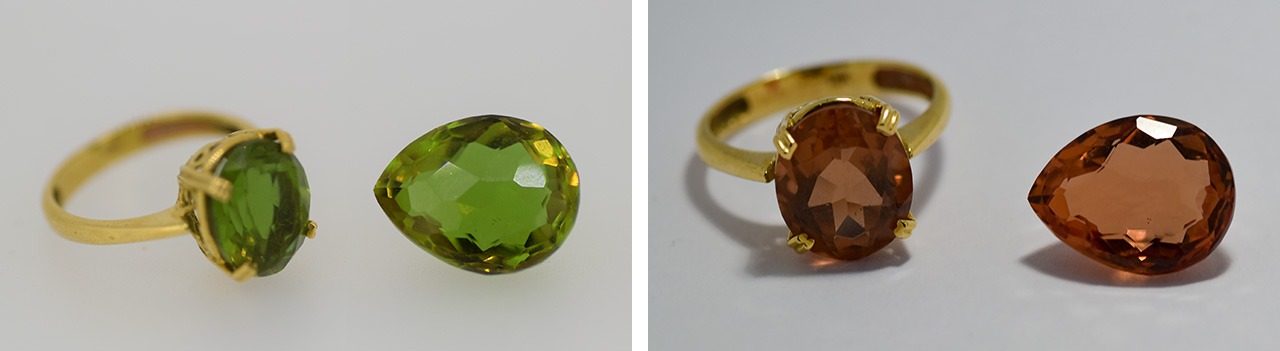
The Gemological Institute of China University of Geosciences in Beijing recently received two samples, an unmounted 8.44 ct 10 × 12 mm faceted pear-shaped specimen and a ring with an 8 × 10 mm faceted oval, that displayed a color-change effect. The material was reportedly purchased from Turkey as Zultanite, a designation the client wished to confirm. Both samples were yellowish green in fluorescent light with a color temperature of 5500 K (figure 1, left) and brownish yellow in incandescent light (figure 1, right). The specimens were fairly clean, with no obvious inclusions and no obvious scratches on the surface. Facet junctions were generally smooth, with small chips. A series of absorption lines related to rare earth elements (REE) were observed by a handheld prism spectroscope. These properties, along with electron microprobe analysis, indicated that the two samples were not diaspore or any other natural material, but rather man-made glass. The infrared spectrum of the unmounted specimen, with peaks at 1037, 462, 443, and 430 cm–1, confirmed the material was glass.
LA-ICP-MS data of three points on the loose sample are reported in table 1. The main trace elements were Nd (102,792 average ppmw) and Pr (68,500 average ppmw), both rare earth elements. Other REE included Gd (1473 average ppmw) and Ce (135 average ppmw). Nd and Pr are the chromophores that cause color change in material such as synthetic cubic zirconia (Fall 2015 GNI, pp. 340–341).
| TABLE 1. LA-ICP-MS data of glass sample (ppmw). | |||
| Element | TG1-01 | TG1-02 | TG1-03 |
| Ti | 65.55 | 64.02 | 64.13 |
| V | 0.618 | 0.614 | 0.621 |
| Cr | 0.740 | 0.832 | 0.818 |
| Mn | 0.882 | 0.861 | 0.756 |
| Fe | 50.68 | 49.78 | 51.31 |
| Co | 0.0462 | 0.0444 | 0.0444 |
| Ni | 0.2291 | 0.2124 | 0.2062 |
| Cu | 13.14 | 12.80 | 13.02 |
| Se | 0.75 | 0.75 | 0.71 |
| Rb | 3.63 | 3.51 | 3.50 |
| Sr | 68.23 | 66.01 | 66.26 |
| Y | 2.381 | 2.29 | 2.319 |
| Cs | 0.028 | 0.0273 | 0.028 |
| La | 4.78 | 4.55 | 4.56 |
| Ce | 139.42 | 133.47 | 134.65 |
| Pr | 69,791.21 | 67,327.64 | 68,381.69 |
| Nd | 104,391.56 | 100,985.23 | 103,001.10 |
| Sm | 0.307 | 0.311 | 0.301 |
| Eu | 0.372 | 0.356 | 0.353 |
| Gd | 1482.77 | 1452.45 | 1480.22 |
| Tb | 24.41 | 23.51 | 23.85 |
| Dy | 8.42 | 7.98 | 7.92 |
| Ho | 0.658 | 0.617 | 0.611 |
| Er | 31.30 | 30.25 | 31.00 |
| Tm | bdl | bdl | bdl |
| Yb | 0.2224 | 0.1979 | 0.2197 |
| Lu | bdl | bdl | bdl |
|
Rare earth elements are displayed in bold text. bdl = below detection limit.
|
|||
The visible-range absorption spectrum of the loose material (figure 2) showed a typical spectrum of glass with rare earth elements. This spectrum showed bands at 443, 479, 529, and 587 nm. The bands at 443, 479, and 529 nm indicate the presence of Pr3+, which caused the green or yellowish green color. The brownish yellow color is related to the 587 nm absorption peak, which is induced by Nd3+.


