Characterization of Tarnish Spots in Chinese High-Purity Gold Jewelry
ABSTRACT
In recent years, red, brown, and black tarnish spots on high-purity gold jewelry (99.9% Au) have been widely reported, mainly in China but also in other parts of the world. Yet the cause of these spots and their possible formation mechanism are unclear. In this study, high-purity gold with typical tarnish spots was systematically investigated using differential contrast microscopy, laser scanning confocal microscopy, SEM, X-ray fluorescence, and X-ray photoelectron spectroscopy. The study detected silver and sulfur along with gold within the tarnish spots. The tested samples all had a gold purity of 99.9%, regardless of whether there was tarnish. Higher-magnification 3-D microscopic observations revealed the typical presence of an “impurity center” within the tarnish spot and a thin film of stain that varied from several nanometers to several hundred nanometers thick. XPS analysis confirmed the presence of both Ag and S in the thin film. An in situ Ar ion sputtering experiment for removing the spot revealed that the sulfur could only be detected at the surface, where the film was less than 12 nm thick. To prevent these tarnish spots, we recommend careful cleaning during the gold manufacturing process and proper care and maintenance to eliminate the possibility of silver contamination.
INTRODUCTION
Tarnish spots or stains with different colors on the surface of gold jewelry or coins, particularly low-purity gold jewelry, have been a concern for several centuries. The low-purity gold jewelry produced in the past usually contained internal impurities such as Ag, Cu, Zn, Ni, Fe, and S, and some external contamination particles that were introduced while in storage or during the plating process. These tarnish spots can be attributed to both a common natural electrochemical reaction and corrosion caused by these impurity metals and contamination particles (Zhen and Wu, 1991).
During the last two decades, surface spots ranging from red to brown and black have been reported on high-purity gold coins from Austria, France, and the United States, as well as Chinese panda coins. Collectors have referred to this as “gold corrosion” (Griesser et al., 2003; Rupprecht et al., 2003; Gusmano et al., 2004; Mayerhofer et al., 2005; Yang et al., 2007a), though it is highly unlikely that gold oxidizes even in a very polluted environment (Yang et al., 2007b). The colored spots on the coins were reported to be mainly composed of Ag2S (Gusmano et al., 2004; Yang et al., 2007a,b).
With the development of gold purification technology in the late 1990s, jewelry with greater than 99.9% purity has become popular in the Chinese market. In recent years, particularly in 2013, colored tarnish spots on the surface of high-purity gold jewelry have been the subject of media speculation (Lu et al., 2013). These reports have raised fundamental questions and concerns for consumers about the quality of gold products. What are these spots, and what are their characteristic features? Why do spots on the same piece of gold jewelry occur in different colors? What is the origin of these spots, and how can they be avoided?
To understand the nature of the various spots, high-purity gold samples with typical tarnish spots were systematically investigated using differential contrast microscopy, laser scanning confocal microscopy, scanning electron microscopy (SEM), as well as X-ray fluorescence (XRF) spectrometry and X-ray photoelectron spectroscopy (XPS).
SAMPLES AND EXPERIMENTAL METHODS
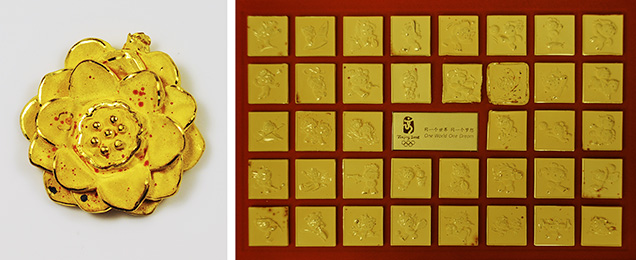
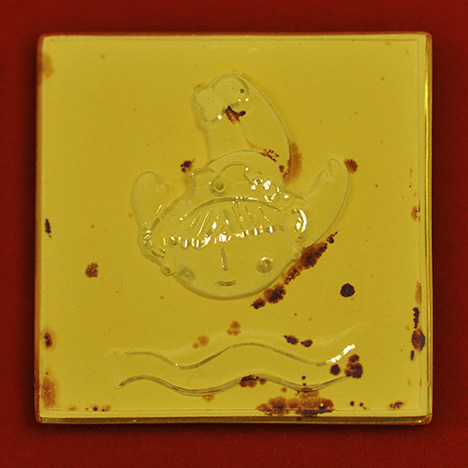
High-purity gold products with typical tarnish spots were collected from four gold retail companies in Hong Kong, Shenzhen, and Beijing. All samples were stated as having gold purity greater than 99.9%. Three of the pieces were curved with artistic patterns and weighed 3.50 g (figure 1, left), 10.00 g, and 63.75 g, respectively. Also tested was a set of 40 high-purity gold collectible pins from the 2008 Summer Olympics in Beijing (figure 1, right), each weighing 1 gram and measuring 32.0 × 32.5 mm. Red, brown, and black spots were clearly visible on the surface of the pins, independent of location. All the samples were stored for at least one year, and the Olympic souvenirs were stored for five years. Flower-patterned pieces such as the one in figure 1 (left) were said to be without spots when first acquired. They were stored in the city of Shenzhen, and spots were clearly visible one year after purchase. The Olympic souvenirs were sealed and stored in a safe deposit box in Beijing, until spots were apparent to the unaided eye in 2012. They were kept in air atmosphere before being shipped for our investigation.
The spots’ color, color distribution, structure, and microstructure were observed using a gem microscope with darkfield illumination, a differential interference contrast microscope (Nikon LV100), a laser scanning confocal microscope (Olympus LEXT OLS4000 3D), and a scanning electron microscope (JSM5600 LV SEM), using various magnifications and illumination conditions. Three-dimensional images and spot thicknesses were obtained and measured using the laser scanning confocal microscope system with image software. The purity of the gold and the chemical composition of the spots were analyzed quantitatively using an X-ray fluorescence spectrometer (Thermo Scientific Quant’X EDXRF analyzer). After the samples were cleaned with ethanol in an ultrasonic bath, their detailed chemical composition was measured using XPS (Thermo Scientific ESCALAB 250 and ESCALAB 250Xi). The XPS was calibrated with two reference points (Ag 2d5/2: 368.3 eV and C 1s: 284.5 eV). To obtain profile depth information on the spots, we removed them using Ar+ ions and performed elemental analysis by XPS etching. Four tarnish spots were removed in this manner. The XPS experiments were conducted using a water-cooled Al Kα anode at 200W and a photoelectron beam spot size of 650 µm.
To identify possible links between the tarnish spots and “pollutant source” technologies, we visited two factories in Shenzhen that produce high-purity gold jewelry. We observed the entire process, represented by the flowchart below:
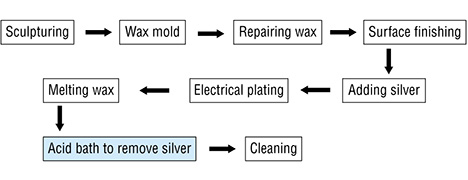
Once the wax object has gone through the carving process, it is painted with silver so that it will be electrically conductive and allow the gold plating. The silver paint is often applied by hand with a fine brush to make sure all the intricately designed areas will receive the coating. Applying with a brush also gives the technician more control in laying down an even coating across the various design elements of each object. The silver paint must be constantly kept swirling in a beaker so that the contents are properly mixed. After the object is completely painted, fine sandpaper is used to remove any imperfections or excess paint buildup. After the electroplating, the thin silver paint layer under the gold is removed by submersing the piece in an acid bath that removes the silver paint but does not affect the gold. But in some cases the removed silver from underneath the gold layer may be deposited on the surface of the gold object, causing spots.
Exposure to the contaminant occurs during the acid bath step. Each piece is supposed to be cleaned in water ten times after the acid bath to remove the silver, but this does not always happen.
RESULTS
Color Characteristics and Fine Structure. It was easy to recognize the tarnish spots, either visually or at low magnification, due to their clear color contrast with the gold background. Their size, shape, and color (including color distribution) varied from sample to sample. The diameter of individual stains ranged from 150 to 1500 µm, with most between 300 and 800 µm; some were as small as 100 µm and others as large as 2 mm. Red, brown, dark brown, and black spots were commonly seen in this study. The spots displayed relatively uniform color distribution at low magnification. They were usually dark circular dots, though irregular shapes also appeared when the spots were connected in patches.
To find the possible growth features and/or microstructures, color distribution, and relationships between the color and the thickness of the thin films of the spots, we performed higher-magnification observations and measurements using differential interference contrast microscopy, laser scanning confocal microscopy, and scanning electron microscopy. The observations are summarized as follows.
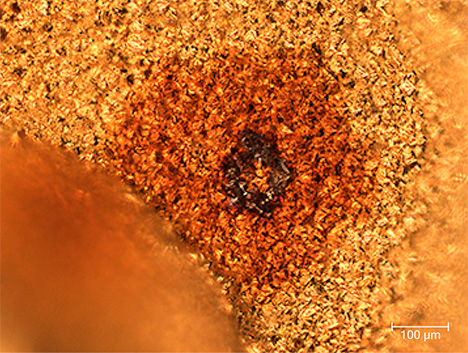
Color Distribution. The color distribution within each spot was usually uneven. In most cases, the spots appeared as a film-like substance on the gold’s surface, consisting of numerous tiny gold crystallites. At the center of each spot was a black circle (figure 2) composed of flaky material that strongly contrasts with the thin film, showing a clear boundary. Most of the films were brown. The film-like material covering the surfaces of the gold crystals was also observed with SEM.
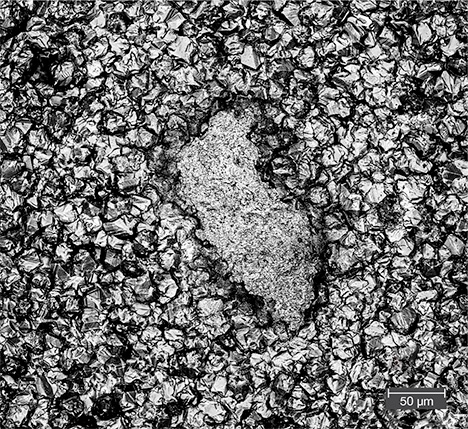
Impurity Particles. The dark center of the spot had an irregular shape with a relatively smooth surface and clear edges with the surrounding thin film. The size of the center varied but usually ranged from 20 to 80 µm. Figure 3 shows a typical example of a black impurity center seen in a brown spot.
Distribution of Tarnish Spots. The distribution of the spots was not random and followed some general patterns. The spots often appeared at intersections, corners, edges, curves, or other geometrically preferential sites on the high-purity gold. Figure 4 shows the distribution of the brown spots observed on a gold collectible pin from the 2008 Olympics. These spots are mainly distributed along the corners and along the edges of features.
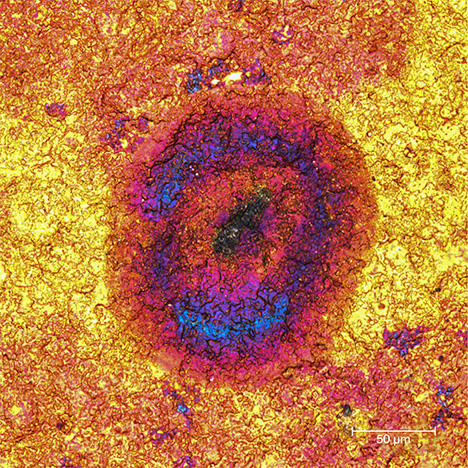
Unusually Colored Zones. While the color distribution within a spot was usually uneven, occasionally pink and/or blue zones were seen within a brown spot in a gold Olympic pin, as shown in figure 5.
Thickness. There was a direct relationship between the depth of color and the thickness of the thin films. The thicker spots tended to be darker. The red spots were not as thick as the brown ones, which in turn were not as thick as the black ones. When we observed and measured the thickness at higher magnification with the laser scanning confocal microscope, we measured from the surface of the tarnish spot to the top of the gold plating. We found that most spots ranged from 190 to 320 nm thick. On very rare occasions, the thickness was more than 1 µm. Figure 6 shows that the thickness of the thin layer on the surface of the gold studied is 190–320 nm, measured by the laser scanning confocal microscope with measurement software.

Gold Purity Analysis. All samples were tested with EDXRF spectrometry to determine their gold purity. Each sample was tested at least three times to confirm the homogeneity, by selecting the areas with and without the brown spots. We found that the gold content in all the tested samples was greater than 99.9%, consistent with the national standard for high-purity gold jewelry (GB 11887-2008). From table 1, we can see that the average gold content was 99.93% for one of the flower-patterned pieces studied. The main trace elements were Cu and Ag, while Ir and Zn were not detected.
| TABLE 1. EDXRF quantitative chemical analysis (wt.%) of a high-purity gold jewelry piece with tarnish spots. | |||||
| Element | Spot 1 (tarnished) |
Spot 2 (tarnished) |
Spot 3 (tarnished) |
||
| Au | 99.91 | 99.93 | 99.95 | ||
| Cu | 0.075 | 0.048 | 0.055 | ||
| Zn | 0.00 | 0.00 | 0.00 | ||
| Ir | 0.00 | 0.00 | 0.00 | ||
| Ag | 0.019 | 0.020 | 0.00 | ||
| S | bdl* | bdl | bdl | ||
|
*Abbreviation: bdl = below detection limit.
|
|||||
XPS Analysis. The chemical composition of the spots was analyzed using X-ray photoelectron spectroscopy (XPS). No silver impurity was recorded in the areas without the spots, but carbon (C 1s, 284.81 eV), oxygen (O 1s, 531.68 eV), sodium (Na 1s, 1069.8 eV), and silicon (Si 2p, 102.2 eV) were detected. These impurities could be attributable to pollution (Yang et al., 2007a). The area with a spot clearly showed two silver peaks located at 367.83 eV and 373.83 eV, which are Ag 3d5/2 and Ag 3d3/2 transitions, respectively, with a difference in binding energy of about 6 eV (figure 7).
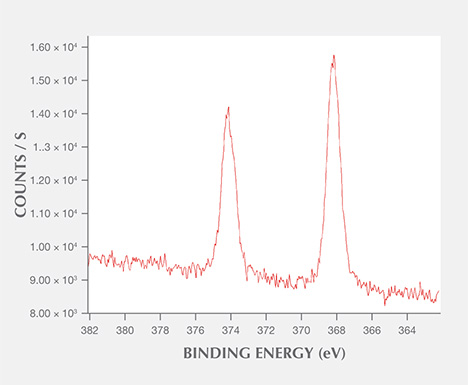
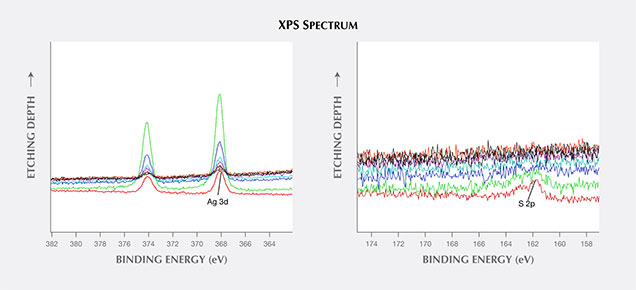
The results of quantitative analysis by Ar+ ion sputtering etching are summarized as follows:
1. At the surface of the spot, the concentrations of gold (Au 4f7, 83.6 eV) and silver (Ag 3d5/2) were similar: 0.54 atomic % and 0.56 atomic %, respectively. According to XPS analysis, the Ag 3d5/2 peak at 367.83 eV represents zero-valent silver metal, while Ag 3d3/2 is attributed to monovalent silver. Comparing the known binding energy positions for possible silver and sulfur compounds (Briggs and Seah, 1990; Wang, 1992; Yang et al., 2007a), we concluded that the spots likely have major Ag2S or Ag2SO4 components, similar to the results reported by Yang et al. (2007a).
2. The silver and sulfur were mainly found at or just under the surface of the tarnish spots, judging from the in situ Ar+ ion etching XPS analysis. In figure 8, the depth profile quantitative data show that the atomic percentage of sulfur was highest at the surface of the spot. After etching approximately 12 nm below the surface, almost no sulfur could be detected. The silver could still be detected, although the peak intensity was much weaker.
3. By plotting a diagram of the Ar+ etching time vs. atomic percentages of Au 4f (83.6 eV), Ag 3d (373.83 eV), and S 2p (161.8 eV) in figure 9, we noted that the Au 4f composition was lowest at the surface, gradually increasing until reaching a saturated level about 8.0 nm below the surface. The atomic percentage of Ag 3d was highest about 1.8 nm from the surface, and S 2p displayed similar behavior.
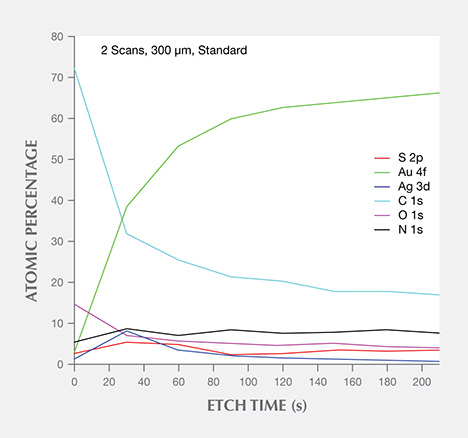
4. Most brown tarnish stains were removed when the Ar+ etching time exceeded about 210 seconds. The calculated thickness of the brown stains, based on the etching rate of 0.06–0.08 nm/s, mostly ranged from 12 to 18 nm. This value was dramatically lower than the laser scanning confocal microscope result because it did not include the textured finish layer (again, see figure 6).
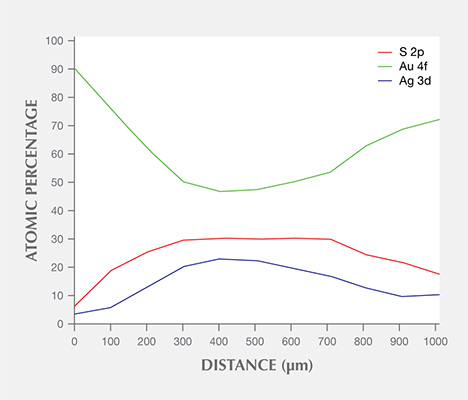
The distribution of Au 4f, Ag 3d, and S 2p laterally across a stain with a diameter of roughly 1000 µm was measured and analyzed (figure 10). It was clear that the Au 4f content was lowest at the center, while both Ag 3d and S 2p were highest at the center; Au, Ag, and S contents were almost flat at the center, which measured about 400 µm wide.
DISCUSSION
As we know, gold is a noble metal that is highly stable in air. The Au/H2O system known as the Pourbaix diagram (Yang and Yang, 1991) clearly shows that at a pH range of 2 to 12, the potential of gold is about 0.3 V higher than that of oxygen. This suggests that gold cannot be oxidized by oxygen or air pollution (Yang and Yang, 1991; Yang et al., 2007a). Theoretically, the tarnish spots of high-purity gold jewelry cannot be attributed to chemical corrosion or oxidation of the gold. In fact, our EDXRF testing of gold jewelry samples confirmed their purity was higher than 99.9%, and the main trace elements were Cu and Ag. XPS quantitative analysis, particularly the in situ etching experiments in both depth and horizontal directions for removing the stains, confirmed that the major chemical components of the stains were Ag and S, in the form of the Ag2S thin film. Judging from the depth profile analysis results, the formation of the tarnish spots is related to silver metal surface contamination. This could stem from external contamination or incomplete cleaning of the silver from the gold piece, which is much closer to the final packing process, based on our factory field investigation. The source of the sulfur could be air pollution. In recent years, the air quality monitoring authority has reported elevated daily concentrations of SO2, CO, CO2, NO2, NH3, H2S, HF, and other gases in Beijing.
Based on experiments related to the formation of tarnish spots on silver, an Ag2S thin film could form around a silver particle nucleus when the environment contains even very low H2S and H2SO4 at room temperature (Kim and Payer, 1999; Payer and Kim, 2002; Kim, 2003; Yang et al., 2007a,b). Figure 11 shows the possible formation process of tarnish spots on high-purity gold jewelry.
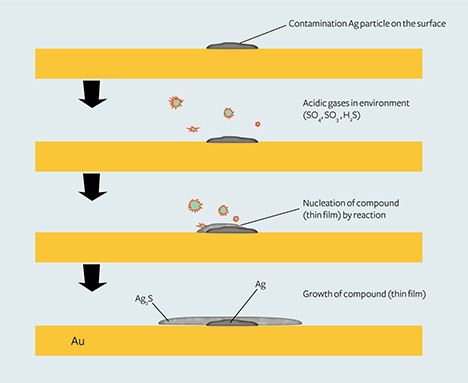
In short, silver particle contaminants on the surface of gold jewelry are the nucleation centers for the Ag2S thin film, and the atmospheric sulfur concentration affects the formation as well as the size of this film.
CONCLUSIONS
Red, brown, and black tarnish spots on the surface of high-purity gold jewelry samples were investigated by differential contrast microscopy, laser scanning confocal microscopy, SEM, X-ray fluorescence, and X-ray photoelectron spectroscopy. Each sample had a gold purity of 99.9%, regardless of the presence of tarnish. Higher-magnification 3D microscopic observations typically revealed an “impurity center” within the tarnish spot, and the thickness of the thin films typically ranged from several nanometers to several hundred nanometers, including the textured finish layer. The “impurity centers” consisted of silver particles, and the thin films of the tarnish spots were composed of Ag2S, judging from the XPS analysis. The in situ Ar ion etching experiment for removing the thin film revealed that the sulfur was only detected at the surface of the tarnish spots where the thickness was less than 12 nm. Therefore, the colored tarnish spots are formed by the chemical reaction between the silver particle contaminants on the surface, and the sulfur-containing components result from air pollution. To prevent these tarnish spots from forming, we recommend improving the cleaning process during gold manufacturing, to eliminate the possibility of silver particle remnants on the surface of high-purity gold jewelry.


