Letters: Analysis of Three-Phase Inclusions in Emerald
In the Summer 2014 issue of Gems & Gemology (pp. 114–132), Sudarat Saeseaw and her colleagues from GIA’s Bangkok laboratory presented a study dealing with three-phase inclusions, absorption spectra, and trace-element analyses for origin determination of emeralds. Examples of three-phase inclusions were presented for samples from Zambia (the Musakashi and Kafubu deposits), the Panjshir Valley in Afghanistan, Davdar in China, and several Colombian localities (Coscuez, Muzo, Peñas Blancas, La Pita, and Chivor).
Unfortunately, the authors did not mention in their literature overview or in their discussion the various other emerald deposits which have supplied samples with three-phase inclusions. These include Nigeria (Henn and Bank, 1991); Capoeirana in Minas Gerais, Brazil (Epstein, 1989); Eastern Himalaya (Niedermayr et al., 2002); the Maria deposit in Mozambique (Vapnik and Moroz, 2002); the Lened emerald prospect in the Northwest Territories of Canada (Marshall et al., 2004); Malipo County in the Yunnan province of China (Huong, 2008); and Eidsvoll in Norway (Rondeau et al., 2008). While some of these occurrences might be of academic interest only, others such as Nigeria, Brazil, and Mozambique have supplied emeralds of gem quality to the market. These localities cannot be ignored in a research paper on origin determination and three-phase inclusions.
Although the chemical data presented in Saeseaw et al.’s table 2 were calibrated using the theoretical Si content of beryl as an internal standard, the laser ablation data show such a wide variation for the main elements that it is impossible to calculate a formula for the samples (compare, for example, the overview of chemical data for emeralds from various sources by Groat et al., 2008). Nevertheless, the authors were able to group their samples into five different categories and to present representative absorption spectra in the UV-Vis-NIR range for one sample from each group. Confusingly, four of the five spectra are labeled “E || c”, but polarized spectra are given for the ordinary ray (ω, equivalent to E ⊥ c) and the extraordinary ray (ε, equivalent to E || c), which is impossible for a primary beam with E || c.
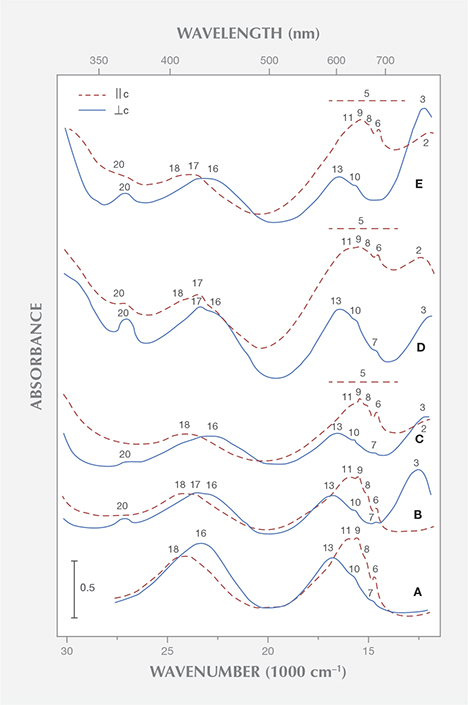
In the spectra of several samples with low iron contents, Saeseaw et al. measured some weak to moderate absorption bands in the near infrared at 810 nm, which were assigned to bivalent iron. In the spectra of samples from Kafubu, Zambia, with higher iron contents, an additional strong absorption band at 620 nm was also assigned to Fe2+. These assignments fail to acknowledge numerous research papers dealing with the role of iron in the beryl structure, which has been established for decades. With regard to the bands mentioned at 810 nm, it has been shown that the intensities of the different iron bands in the near infrared with polarization || or ⊥ c are not directly correlated. Consequently, these absorption bands have been assigned to two different types or coordination states of iron, most likely to Fe2+ in tetrahedral and octahedral sites of the beryl lattice. Concerning the band noted at 620 nm, it has likewise been demonstrated that the intensities of the iron-related absorption bands in the near infrared are not directly correlated with the intensity of this broad band, polarized || c in the visible region around 620 nm (figure 1). Thus the broad absorption from about 600 to 750 nm in the spectra of Kafubu emeralds has been assigned to Fe2+/Fe3+ charge transfer (Schmetzer and Bank, 1981). This indicates that emeralds from Zambia’s Miku-Kafubu mining range contain, in addition to chromium as the dominant color-causing trace element, a distinct aquamarine component (figure 2). The aquamarine component is responsible for a color shift and pleochroism, especially of the color || c from green or bluish green in “ordinary” emeralds to greenish blue or blue in samples with such an aquamarine component. Emeralds from multiple sources show this phenomenon and similar absorption spectra (e.g., Schmetzer, 1988; Henn and Bank, 1991; Henn, 1992; Hänni, 1992; Moroz et al., 1999).


Another frequently occurring trace element in natural emeralds from various localities is vanadium. According to Saeseaw et al., vanadium absorption bands are observed in natural vanadium-bearing emeralds in the ω spectrum (equivalent to E ⊥ c) at 400 nm and in the ε spectrum (equivalent to E || c) at 654 nm. Natural vanadium-bearing, chromium-free emeralds are rare but have been documented (from Salininha, Brazil, for instance). These also reveal distinct amounts of iron, and the various bands in the absorption spectrum of this type of beryl have been assigned to vanadium and iron (Wood and Nassau, 1968). Nearly iron- and chromium-free samples have been grown synthetically; they are commercially available from Biron in Perth, Australia (Schwarz and Schmetzer, 2001), and from Tairus in Novosibirsk, Russia (Schmetzer et al., 2006; see also the summary of references describing vanadium-related absorption spectra in that paper).
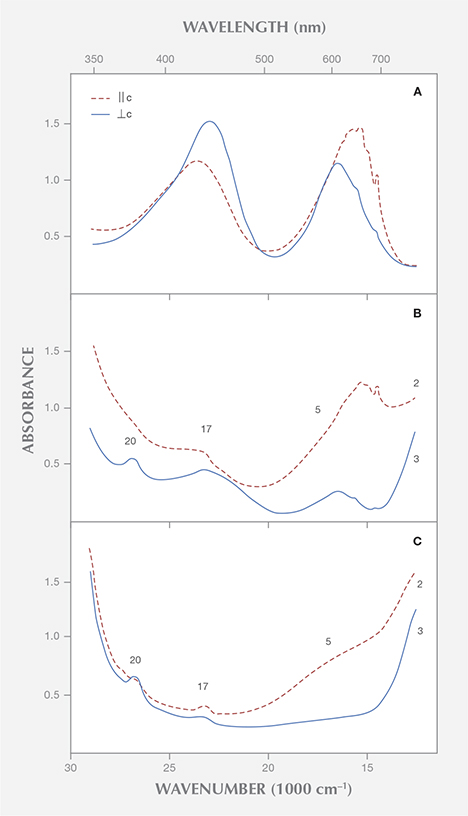
Without going into the details of these spectra or discussing the possible presence of vanadium in valence states other than V3+ (see Hutton et al., 1991), it is evident that the spectrum of trivalent vanadium in beryl consists of two strong absorption bands in the visible range (figure 3). Parts of these absorption bands are split into different maxima or show various shoulders, but both absorption maxima are, in contrast to the spectroscopic characteristics noted by Saeseaw et al., present in both polarization directions, parallel and perpendicular to the c-axis.
Natural beryl from most sources reveals some traces of both vanadium and chromium. The ratio of vanadium to chromium varies considerably, especially in samples from the Colombian emerald deposits (Schwarz, 1992). Because the absorption bands of these two trace elements are found in the same spectral range, vanadium- and chromium-related absorptions are superimposed in the spectra of emeralds containing both trace elements. As a result, the different vanadium and chromium maxima are not shown individually (figure 3).

The vanadium-chromium ratio in natural emeralds can be approximated from the intensity of the spin-forbidden sharp chromium bands in the 600–700 nm range of the vanadium-chromium spectra. These bands are stronger in samples with distinctly higher chromium than vanadium contents (figure 3A) and become weaker in samples with almost equal chromium and vanadium contents (figure 3B). Furthermore, in samples with distinct vanadium contents, the strong absorption band in the bluish violet range at about 430 nm displays a shoulder in the ultraviolet near 395 nm, observed in both polarization directions, || or ⊥ c (see figures 3B and 3C).
Emeralds from Davdar, China, reveal appreciable amounts of vanadium and chromium (Schwarz and Pardieu, 2009), and they can be distinctly zoned, with a wide variation of vanadium and chromium contents in various growth sectors of the same crystal (Marshall et al., 2012). In Saeseaw et al.’s spectrum for an emerald from Davdar, the sharp chromium lines are distinct and the shoulder in the UV is weak (in the spectrum ⊥ c) or almost invisible (in the spectrum || c), although a vanadium to chromium ratio of about 4:1 is reported for that sample. With such a high ratio, the sharp chromium lines should be noticeably weaker and the vanadium shoulder in the UV should be more intense. Therefore, it would seem desirable to control the chemical analyses obtained by laser ablation, especially for determining the concentration of vanadium and chromium, with other non-destructive methods such as X-ray fluorescence or electron microprobe.
Dr. Karl Schmetzer
Petershausen, Germany
September 3, 2014
Reply
We appreciate the opportunity to answer Dr. Schmetzer’s interesting and informed response to our article. First of all, he has provided several helpful bibliographic references about multiphase inclusions in emeralds from a variety of geographic sources. Nevertheless, the stated purpose of our study was to compare the inclusions in emeralds from the new deposit in Musakashi (Zambia) with those from different sources in our Bangkok reference collection using standard laboratory equipment. In that regard, our article can be considered a preliminary study rather than the final word on the subject.
Dr. Schmetzer goes on to ask about our system of labeling wafers for spectroscopy. In our article, “E ∥ c” means that the wafer plane is parallel to the c-axis, which enables us to collect both ω and ε rays.
Regarding Dr. Schmetzer’s concerns about UV-Vis spectra, we focused our study on inclusions. Nevertheless, we provided some significant spectroscopic and chemical data, as these techniques are very important in emerald origin determination. Dr. Schmetzer’s specific inquiries about UV-Vis spectra and iron and vanadium contributions are beyond the scope of our article. To understand clearly how impurity affects color in beryl, we would have needed to test known samples of beryl doped with different elements. This would have taken our study in an altogether different direction.
Lastly, Dr. Schmetzer points out our inability to correlate the LA-ICP-MS chemical data with the UV-Vis spectra for one emerald from the Davdar deposit. He suggests controlling our LA-ICP-MS data with other techniques. In our opinion, the lack of correlation has more to do with the fact that these different techniques are not analyzing the same thing: UV-Vis spectroscopy is a bulk analysis, while LA-ICP-MS is a spot analysis (40 microns in diameter in this study). As a result, UV-Vis spectroscopy and LA-ICP-MS usually do not provide a perfect correlation when it comes to inhomogeneous natural emeralds with color zoning and inclusions, such as the emerald from Davdar.
Again, we thank Dr. Schmetzer for his comments and assure him that GIA plans to obtain and study more emeralds from different mining areas, to further our lab’s capacity to provide accurate origin determination reports.
Sudarat Saeseaw, Vincent Pardieu, and Supharat Sangsawong
GIA, Bangkok


