Study of the Blue Moon Diamond
ABSTRACT
The Blue Moon diamond, discovered in January 2014 at the historic Cullinan mine in South Africa, is of significance from both trade and scientific perspectives. The 29.62 ct rough yielded a 12.03 ct Fancy Vivid blue, Internally Flawless gem. The authors were provided the opportunity to study this rare diamond at the Smithsonian Institution before it went on exhibit at the Natural History Museum of Los Angeles County. Infrared spectroscopy revealed that the amount of uncompensated boron in the diamond was 0.26 ± 0.04 ppm, consistent with measurements of several large type IIb blue diamonds previously studied. After exposure to short-wave ultraviolet light, the Blue Moon displayed orange-red phosphorescence that remained visible for up to 20 seconds. This observation was surprising, as orange-red phosphorescence is typically associated with diamonds of Indian origin, such as the Hope and the Wittelsbach-Graff. Time-resolved phosphorescence spectra exhibited peaks at 660 and 500 nm, typical for natural type II blue diamonds. As with most natural diamonds, the Blue Moon showed strain-induced birefringence.
INTRODUCTION
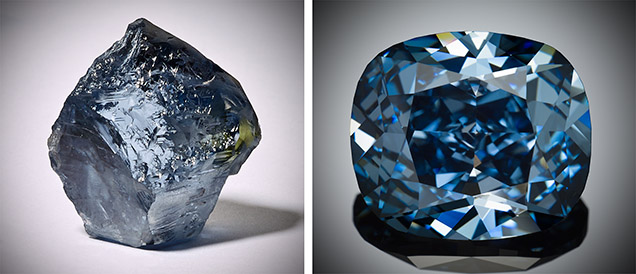
The Blue Moon diamond drew widespread media attention when the discovery of the 29.62 ct rough (figure 1, left) at the Cullinan mine in South Africa was announced in January 2014. This mine, formerly known as the Premier, is also the source of the historic Cullinan diamond, as well as two other important blue diamonds: the Smithsonian Institution’s Blue Heart, a 30.62 ct Fancy Deep blue gem discovered in 1908, and the 27.64 ct Fancy Vivid blue Heart of Eternity, unveiled by Steinmetz in 2000. The publicity only increased when the rough was purchased a month later by Cora International LLC for $25.6 million, setting a record price per carat for a rough stone (Bronstein, 2014). In June 2014, after a few months of examination, the diamond was cut into a 12.03 ct cushion, graded by GIA as Fancy Vivid blue and Internally Flawless (figure 1, right). Cora International named it the Blue Moon diamond as a tribute to its rarity. The Blue Moon made its first public appearance at the Natural History Museum of Los Angeles County (NHMLAC) on September 13, 2014, for a temporary exhibit running through January 6, 2015.
The Cullinan mine produces the most type II diamonds of any mine (King et al., 1998). In 2014 alone it yielded the Blue Moon as well as a 122.52 ct type IIb light blue diamond and a 232.08 ct type IIa colorless diamond, both of them rough stones. Additionally, the largest rough diamond of all time was discovered at the Cullinan mine in 1905. The Cullinan diamond, a 3,106.75 ct type IIa colorless stone, was eventually cut into several stones. The two largest (545.67 and 317.40 ct) reside in the British Crown Jewels (Balfour, 2009). Because of its rare color and size, the Blue Moon can be added to the list of significant diamonds from the Cullinan mine.
The Blue Moon represents a noteworthy blue diamond discovery, as an exceptional gem and as a rare specimen for scientific study. In a recent study that investigated the relationships among color saturation, phosphorescence properties, and concentrations of boron and other impurities in type IIb blue diamonds (Gaillou et al., 2012), one variable was largely excluded: geographic origin. Among the 76 stones studied, only a dozen were of known origin. This is not surprising, as information about a diamond’s mine or even country of origin is rarely retained. The exceptions are stones such as the Hope and the Wittelsbach-Graff diamonds, which are known to be alluvial stones from near Golconda in India, and the Blue Heart and the nine blue diamonds in the Cullinan necklace, which are from the Cullinan mine. The Blue Moon adds to this list of important blue diamonds with a known origin. It is also the first Fancy Vivid blue that the authors have been able to examine in detail.
MATERIALS AND METHODS
The Blue Moon diamond has a cushion modified brilliant cut, weighs 12.03 ct, and measures 15.57 × 13.47 × 7.55 mm. Its small culet facet enabled us to perform spectroscopy through the parallel faces of the table and the culet. Analyses were conducted at the Smithsonian Institution’s Department of Mineral Sciences (figure 2). Fourier-transform infrared spectra were acquired using a Thermo Scientific Nicolet 6700 FTIR spectrometer and Nicolet Continuum microscope (figure 2, left). Spectra were collected with a spectral resolution of 4 cm–1 and an accumulation of 128 scans. The IR light was focused on the culet facet with an aperture of 150 × 150 µm.
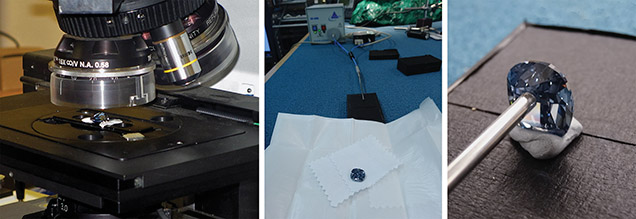
Phosphorescence was visually observed using portable short-wave and long-wave ultraviolet lights, with main excitation wavelengths of 254 and 365 nm, respectively. Phosphorescence spectra were collected using the portable spectrometer described by Eaton-Magaña et al. (2008) and shown in figure 2, center. The diamond was excited with an Ocean Optics DH-2000 deuterium UV lamp (215–400 nm), and the signal was acquired with an Ocean Optics USB2000 charge-coupled device (CCD) spectrometer through a fiber-optic bundle. The UV radiation was transferred through a bundle of six optical fibers, each 600 μm in diameter. A seventh fiber in the core of the bundle collected the emitted light from the diamond and delivered it to the entrance aperture of the CCD spectrometer. The tip of the fiber-optic bundle was placed directly in contact with four different areas of the diamond (figure 2, right) to sample possible spatial variations in the spectra. The phosphorescence spectra were collected after 10 seconds of UV light exposure. The spectra acquisition began 500 ms after the light was turned off. During decay, the spectra were integrated and recorded at 2.0, 1.0, and 0.5 second intervals, respectively. Only the results for the spectra with 1.0 second intervals are presented here, as it is the most representative data.
To examine birefringence resulting from internal strain in diamond, we placed the stone between crossed polarizers and observed it using transmitted light.
RESULTS
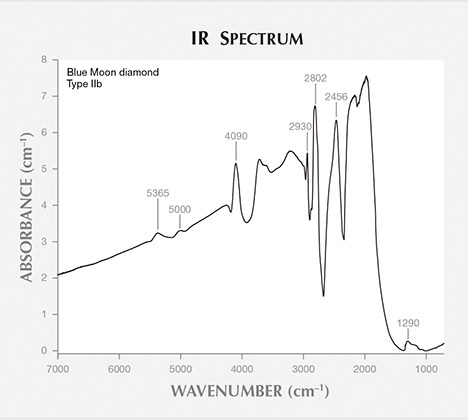
FTIR spectrometry (figure 3) confirmed that the Blue Moon is a type IIb diamond—in other words, it lacks nitrogen observable by FTIR in the 900–1400 cm–1 region, and it contains boron. Due to the diamond’s long IR beam path (7.55 mm) from the culet facet through the table, most of the spectral features related to boron showed almost complete absorption. The boron peaks were positioned at 1290, 2456, 2802, 2930, 4090, 5000, and 5365 cm–1. The area near the 2802 cm–1 peak is typically used to calculate the concentration of uncompensated boron (Collins and Williams, 1971; Fisher et al., 2009), but this peak was saturated and could not be used to estimate boron concentration. Instead we used a secondary peak at 1290 cm–1, as in the method developed by Collins (2010). After normalization, the boron peak at 1290 cm–1 had an absorption height of 0.115 cm–1, corresponding to a boron concentration of 0.26 ± 0.04 ppm (Collins, 2010). As this value represents only uncompensated boron—not charge-compensated by other impurities such as nitrogen—the total boron content is at least equal to this measured value, plus potentially some unknown amount of compensated boron. The Blue Moon’s value of 0.26 ppm is within the average of several notable blue diamonds. Compare this with the uncompensated boron averages of 0.36 ± 0.06 ppm for the 45.52 ct Hope, 0.19 ± 0.03 ppm for the 31.06 ct Wittelsbach-Graff, 0.24 ± 0.04 ppm for the 30.62 ct Blue Heart, and 0.31 ± 0.003 ppm for the 2.60 ct Cullinan Blue (Gaillou et al., 2012).
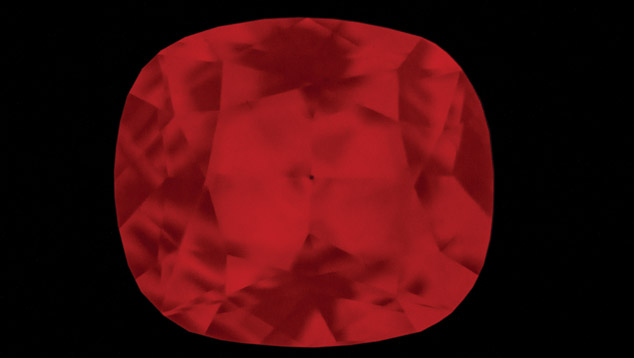
The Blue Moon did not show any obvious fluorescence (i.e., there was no visible emission of light while the diamond was excited by a UV light), in keeping with the type IIb blue diamonds we have examined. It did show phosphorescence, in the form of an intense orange-red glow after exposure to UV light. The phosphorescence was most intense after exposure to short-wave UV light and remained visible to dark-sensitized eyes for up to 20 seconds (figure 4).
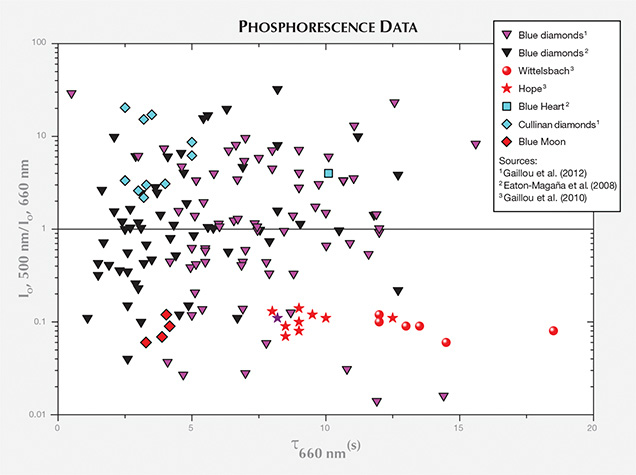
Time-resolved spectra for the light emitted during phosphorescence are presented in table 1 and in figure 5. As previously observed for all natural, untreated type IIb blue diamonds, the Blue Moon’s phosphorescence spectra showed two emission bands: one at 660 nm and another at 500 nm that decreased more rapidly. Previous studies (Gaillou et al., 2012) have demonstrated that different diamonds can have different relative intensities of those two bands. Diamonds with a dominant 500 nm band exhibit a brief bluish phosphorescence; if the 660 nm peak is more intense, the diamond shows an orange-red glow (Eaton-Magaña et al., 2008; Eaton-Magaña and Lu, 2011; Gaillou et al., 2012). The Blue Moon displayed an intense 660 nm band and a weak 500 nm band (hence the observed orange-red phosphorescence). The 500 nm peak disappeared completely within seconds, while the 660 nm band faded away after 25 seconds (with a half-life of about four seconds). Only a third of the type IIb diamonds examined by Gaillou et al. (2012) showed a stronger emission at 660 nm than at 500 nm (figure 6). The Blue Moon belongs to this minority, along with the Hope and the Wittelsbach-Graff (Gaillou et al., 2010; figure 7). Several spectra were acquired across the stone: in the center of the table, on the edge of the table, on the girdle, and on the culet (table 1). The slight differences are not significant, indicating that the phosphorescence is homogeneous, at least to the resolution of our measurements.
| TABLE 1. Phosphorescence data acquired from the Blue Moon diamond. | |||||
| Area probed |
Initial intensity,
500 nm band
(counts) |
Initial intensity,
660 nm band
(counts) |
Ratio of initial
intensities,
500 nm/
660 nm bands |
Half-life,
500 nm band (seconds)
|
Half-life,
660 nm band (seconds)
|
| Table off-center |
5.34 | 77.34 | 0.07 | 2.28 | 3.88 |
| Table center | 5.00 | 90.43 | 0.06 | 1.00 | 3.28 |
| Culet | 7.22 | 78.65 | 0.09 | 1.19 | 4.17 |
| Girdle | 13.00 | 107.00 | 0.12 | 1.75 | 4.04 |
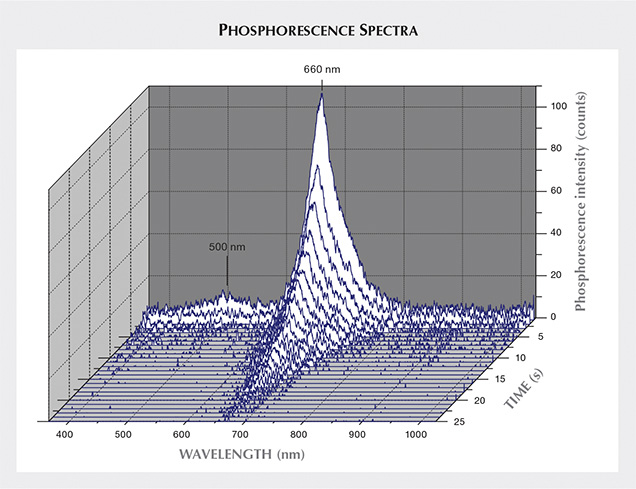
The cause of the 500 and 660 nm emissions is not fully understood, but it has been suggested that they might be produced by the recombination of donor-acceptor pairs (nitrogen and boron, respectively). The 660 nm band may also have a component influenced by plastic deformation (Eaton-Magaña et al., 2008; Eaton-Magaña and Lu, 2011; Gaillou et al., 2012).

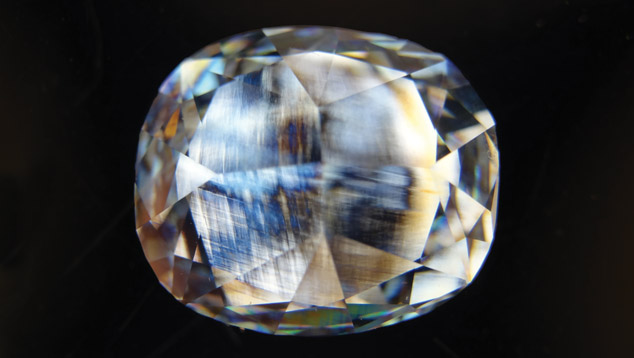
Finally, the Blue Moon was examined between crossed polarizers with transmitted light to observe the anomalous birefringence found in many diamonds, especially type II samples (Lang, 1967). While diamonds are cubic and should not show any birefringence, most do display some birefringence due to residual strain in the diamond structure (e.g., Lang, 1967; Hanley et al., 1977; Collins et al., 2000; Kanda et al., 2005). The Blue Moon displayed the typical “tatami” pattern (two directions of strain lamination) with gray and blue interference colors (figure 8). The tatami pattern was visible in every direction through the diamond. The laminations of the tatami patterns are oriented in the [111] planes, the “weak” planes of diamonds corresponding to the octahedral faces.
DISCUSSION AND CONCLUSION
While the Blue Moon diamond has a Fancy Vivid blue color, its uncompensated boron concentration of 0.26 ppm is in the lower range of values of blue diamonds recorded in a previous study (Gaillou et al., 2012). But the value is similar to that of other large type IIb blue diamonds such as the Hope, the Wittelsbach-Graff, and the Blue Heart (Eaton-Magaña et al., 2008; Gaillou et al., 2012; again, see figure 7). While the uncompensated boron concentration might not represent the total boron content, it is the only boron that is active in the infrared and visible parts of the spectrum and contributes to the blue bodycolor (e.g., Collins, 1982). Gaillou et al. (2012) showed a lack of a strong correlation between color saturation (as graded by GIA on a scale from light to deep saturation) and uncompensated boron content. For a parallel slab of type IIb diamond, the bodycolor is a function of the uncompensated boron concentration and the thickness of the slab, and maybe other components; for a faceted gem the perceived color also depends on the shape and the cut.
Perhaps the most surprising result is that the Blue Moon shows an intense and relatively long-lasting orange-red phosphorescence. We are aware of only one other type IIb diamond from the Cullinan mine with orange-red phosphorescence (King et al., 2003). Type IIb diamonds with orange-red phosphorescence more commonly originated in India or Venezuela (Gaillou et al., 2010, 2012; personal communication with Thomas Hainschwang in 2011 on the Indian blue diamond collection of the Natural History Museum in Vienna). The nine diamonds from the Cullinan mine studied by Gaillou et al. (2012) showed the more typical brief bluish phosphorescence (again, see figures 6 and 7). The Blue Moon underscores the fact that the phosphorescence behavior of type IIb diamonds is not tied to a specific geographical source.


