Gemological and Trace Element Characteristics of Cassiterite from Yunling, China
ABSTRACT
The Yunling area in Yongde County of China’s Yunnan Province is a significant source of gem-quality cassiterite. This study is an initial report on the gemological characteristics, internal features, absorption spectra, and trace element chemistry of this material.
Cut stones from Yunling typically range from 1 to 2 ct, and larger ones exceeding 20 ct are generally rare. Their colors range from near-colorless to various tones of brown, light brown, brownish pink, light gray, and black. Red color, resulting from iron oxide staining within fractures, is rare and was observed in only one of the stones we examined. The samples from this study had a specific gravity of 6.85–7.04 and did not fluoresce under long-wave or short-wave UV light. Internal features included concentric brown bands, irregular zones of gray to black colors, and multiphase fluid inclusions, with tourmaline and beryl as the primary mineral inclusions. Mica inclusions, though less frequent, were also observed.
Among the seven color groups identified for this cassiterite, chemical analyses revealed variable levels of titanium (8.08–1155 ppmw) and iron (26–425 ppmw); these were the most abundant trace elements in all color groups except black. Tungsten and uranium were only enriched in the black samples. Variations in the ultraviolet/visible/near-infrared absorption spectra for the observed color differences in the cassiterite point to possible causes. Specifically, the black coloration is associated with tungsten and oxygen vacancies, while brown and red colors are influenced by oxygen vacancies and iron oxide staining, respectively. When comparing the chemical composition profiles of cassiterite from Yunling and Viloco (Bolivia), notable differences were observed in the trace element ranges and averages. Trace element plots of Sb-Ni and Fe-Nd can be useful in distinguishing between cassiterite from the two localities.
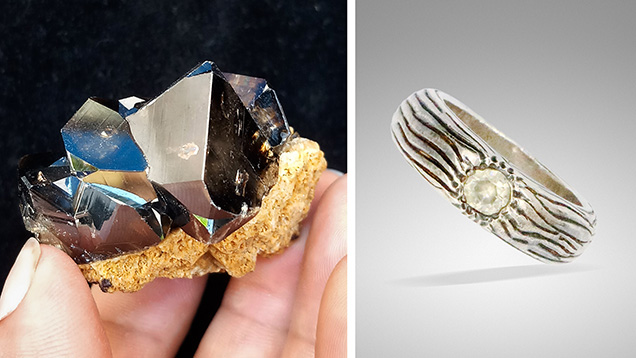
Cassiterite (SnO2) is a common ore mineral found in tin deposits that are spatially and genetically related to highly evolved granites (Lehmann, 2021; Ni et al., 2023). These granites originate from melts that have undergone intensive fractional crystallization (Wu et al., 2017). However, cassiterite crystals are typically opaque or small, making them unsuitable for use as gem material. In rare cases, gem-quality cassiterite has been found. One well-known example is the Viloco deposit in Bolivia (Hyršl and Petrov, 1998; Hyršl, 2002). Two lesser-known locations in China, specifically Yunling in Yongde County and Amo in Ximeng County, both situated in the Yunnan Province, also produce gem-quality cassiterite (figure 1) (Moore, 2004; Ottens, 2008, 2021; Wu, 2013; Huang and Pan, 2021; Huang et al., 2023).
Cassiterite has a structure similar to that of rutile, where each tin ion is surrounded by six oxygen ions at the corners of a regular octahedron. It exhibits uniaxial characteristics and displays exceptionally high refractive index (RI; nω=1.990–2.010, nε=2.093–2.100) and birefringence values (0.096–0.098) (Deer et al., 1992). Additionally, cassiterite has a very high specific gravity (SG) of approximately 7 and strong dispersion (0.071, roughly twice that of diamond). Its hardness is 6.5 on the Mohs scale, and twinning is common on {011} planes, resulting in the formation of the recognizable geniculate twin (also known as an “elbow” or “knee-shaped” twin). It is important to note that confusion with synthetic moissanite is possible because of that material’s high birefringence (0.043) and dispersion (0.104).

The Yunling mine is situated near the village of Yunling in Yongde County in western Yunnan Province (figure 2). Cassiterite extracted from the mine was initially used for industrial purposes as the main ore mineral for tin in the early 1980s. However, it was later discovered that some of these ore pieces were of gem quality. In 2006, a mining company authorized by the local government began exploring tin ore until the mining rights expired in 2013 (Gu, 2010). Today, cassiterite specimens are occasionally extracted and collected by local villagers.
Considerable quantities of cassiterite have been mined as mineral specimens over the past three decades, and specimens on matrix rocks are highly sought after by mineral collectors (Ottens, 2008, 2021; Wu, 2013). Recently, a significant amount of faceted cassiterite, reportedly from the Yunling region, has appeared on the Chinese market, mainly in the provinces of Yunnan and Guangxi. However, the supply of gem-quality cassiterite is inconsistent, and it remains more of a collector’s gemstone. These stones are commonly near-colorless and brown, though other color varieties such as black and brownish pink are occasionally encountered.
Documentation of the Yunling deposit has been limited, focusing mainly on the regional and deposit geology as well as the nature of the host granite (Nie et al., 2012; Wang et al., 2014; Xiao et al., 2022). Wu (2013) briefly documented the color categories and dimensions of rough cassiterite crystal specimens from the Yunling mine. However, the detailed gemological properties and chemical compositions that are critical for identification, evaluation, and geographic origin determination remained lacking.
This article provides an overview of the geology of the Yunling cassiterite deposit and offers a detailed description of gemological properties, inclusion scenes, absorption spectra, and geochemical composition analysis by laser ablation–inductively coupled plasma–mass spectrometry (LA-ICP-MS).
GEOLOGICAL SETTING
Regional Geology. The Yunling cassiterite deposit is situated in the Changning-Menglian Belt of the Sanjiang Tethys tectonic region, which is at the southeastern margin of the Tibetan Plateau (figure 3, A and B). This region is recognized as one of China’s significant tin belts. Tin deposits in the Sanjiang Tethys domain are found mainly in the Tengchong block, followed by the Baoshan block and the Changning-Menglian orogenic belt (e.g., Wang et al., 2014). The granitoids in the first two terranes span from the Early Paleozoic to the Paleogene periods (figure 3B). The Changning-Menglian Belt is delineated by the Kejie fault to the west and the Shuangjiang fault to the east (figure 3C), and it originated from the collision between the Tengchong-Baoshan block and the Simao block (Wang et al., 2014). Granitic rocks in the Changning-Menglian Belt (figure 3C) are primarily granodiorite in composition and fall into the high-potassium calc-alkaline series (Nie et al., 2012; Wang et al., 2014). Based on geochronological studies, the granitoids in this belt exhibit ages ranging from the Late Triassic to the Tertiary (Yu et al., 2008; Nie et al., 2012; Xiao et al., 2022). The Changning-Menglian Belt hosts several medium-sized tin deposits, including Haobadi, Yunling, and Damasa. The Amo deposit, located in the southern part of the belt (figure 3C), is also recognized for its gem-quality cassiterite (Huang and Pan, 2021).


Geology of the Deposit. The Yunling tin deposit is located in the northern section of the Changning-Menglian Belt, as shown in figure 3C. The stratigraphic sequence in this area is characterized by the Mid-Jurassic Luzijing formation, the Changning formation, the Chujiashan formation, and the Liguo formation, the latter three dating back to the Cambrian (figure 4). The intrusive rocks exposed in the region mainly consist of biotite monzogranite, referred to as Yunling granite in the Yunnan Geological Survey Report (Li, 1985), alongside minor occurrences of migmatite and monzonite veins (figure 4). The predominant rock type within the Yunling pluton is biotite monzogranite, classified as peraluminous S-type granite and belonging to the high-potassium calc-alkaline series (Nie et al., 2012; Zhang et al., 2012). Through zircon U-Pb dating, the age of the biotite monzogranite has been determined to be 231.4 ± 3.8 Ma (Nie et al., 2012).
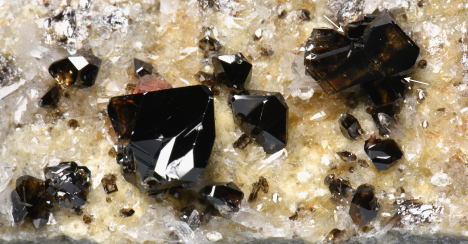
Structurally, the major faults in the Yunling area strike in the east-west (EW) and north-south (NS) directions, with mineralization occurring mostly within the biotite monzogranite (figure 4). The primary tin orebodies, including V10, V12, and V17, exhibit an average tin grade of 1.5%; orebody V17 is the largest, boasting a strike length of approximately 1000 m. Wall-rock alteration consists of greisenization, tourmalinization, and to a lesser extent, fluoritization. Ore types include cassiterite-mica-quartz-pyrite veins (figure 5) and greisen-type mineralization where cassiterite is distributed within greisenized granite. Cassiterite grains within the veins typically range from 0.1 to 1.0 mm in size, with some crystals reaching 10–20 mm or larger, characterized by high transparency and gem quality. Gem-quality cassiterite has also been reported from miarolitic cavities.
MATERIALS AND METHODS
Samples. Forty-one samples, reportedly from the Yunling area, were utilized for this study. They were acquired by author WH from Yongming Shi, a reputable collector and merchant in Yunnan Province. The cassiterite materials were sourced from orebody V17 and adjacent small-scale veins, located around 500–800 m east-southeast and 600–1100 m northeast of the Yunling village by local villagers hired by Yongming Shi. These samples comprised 17 faceted stones ranging from 0.54–2.14 ct (figure 6) and 24 rough stones weighing 10–38 ct (figure 7). Out of the 24 rough stones, 10 pieces (samples C-G1 to C-G10) underwent gemological characterization along with the 17 faceted stones, while all 24 rough stones were subsequently cut and polished into thin sections. The faceted samples were categorized into seven groups based on their color: near-colorless (two samples), light gray (two samples), light brown (five samples), brownish pink (three samples), red (one sample), brown (two samples), and black (two samples). These encompassed the full spectrum of cassiterite colors from the Yunling mine. The rough samples were cut into thin sections in specific orientations to preserve any color bands or domains and then double-side polished to a thickness of approximately 200 μm, primarily for microscopic observation and Raman spectroscopic analysis.
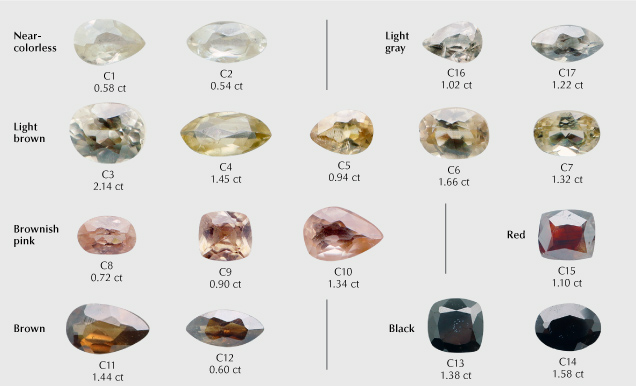
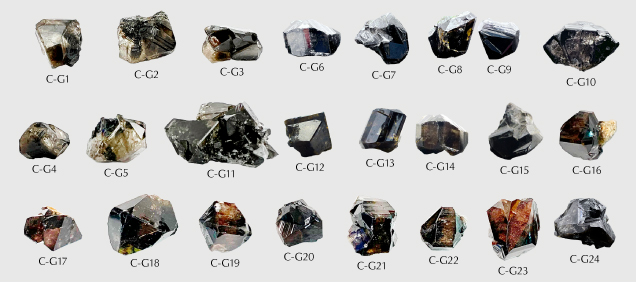
Standard Gemological Testing. Standard gemological analyses were completed on all 17 faceted stones and 10 of the 24 rough stones (samples C-G1 to C-G10) at the National Center of Inspection and Testing on Quality of Gold and Silver Products (NGSTC). RI was determined using an optical gem refractometer, and fluorescence reaction was determined using long-wave (365 nm) and short-wave (254 nm) UV lamps. Pleochroism was identified with a pocket dichroscope, and SG was measured through the hydrostatic method.
Microscopic Analysis and Spectroscopy. Microscopic features of the 24 cassiterite thin sections were observed using a Leica microscope attached to a digital camera, and photomicrographs were taken at magnifications ranging from 25× to 500×. To process the inclusion scenes, we employed the focus stacking technique, also known as extended depth of focus, as described by Renfro (2015). This method involves capturing a series of images at various focal planes and digitally combining them to create a single image with an extended depth of field, revealing intricate details of the inclusion scenes at different depths. For improved color distribution observation, the 17 faceted stones were immersed in methylene iodide. A gemological microscope MV5000 with diffused lighting, transmission light illumination, and a magnification of 20×–40× was utilized for observation.
To identify mineral inclusions and the compositions of fluid inclusions in cassiterite, spot analysis using Raman spectroscopy was applied on the 24 thin sections. Raman analysis was performed at the State Key Laboratory for Mineral Deposits Research, Nanjing University, using a Renishaw RM200 Raman system. An Ar+ laser with a surface power of 5 mW and a wavelength of 514.5 nm was used. The scanning range was set from 4000 to 100 cm–1, with a grating of 1800 grooves/mm selected. Each measurement involved a 30-second accumulation time. Raman mapping was applied to measure a multi-solid inclusion using a Renishaw inVia Raman spectrometer at the Anhui Provincial Institute of Geological Experiments. The instrumental setup consisted of a 532 nm laser, a grating of 600 grooves/mm, and a spectral range of 4000–100 cm–1. The mapping was conducted with a step size of 1 × 1 μm, a measurement time of 1 second per spot, and two measurements per spot. The spectrometers were calibrated daily using monocrystalline silicon at 520.7 cm–1. The RRUFF database (Lafuente et al., 2016) and published literature by Wang et al. (2015) and Lensing-Burgdorf et al. (2017) were used as references for mineral phase identification.
Ultraviolet/visible/near-infrared (UV-Vis-NIR) absorption spectra were obtained on the 17 faceted stones using a BiaoQi Optoelectronics GEM-3000 spectrometer. The spectra were acquired at room temperature with a resolution of 1 nm, an integration time of 100 ms, an average of 15 measurements, a smoothing width of 1, and a scanning range of 220–1000 nm.
Trace Element Analysis. LA-ICP-MS trace element analyses were also conducted at the State Key Laboratory for Mineral Deposits Research, Nanjing University, using a Coherent 193 nm excimer laser ablation system coupled to a PerkinElmer NexION 350 ICP mass spectrometer. Both the sample and NIST 610 were loaded simultaneously into the ablation cell of a GeoLas HD system. The ICP-MS system was fine-tuned to achieve maximum sensitivity and reduce oxide production rate by maintaining ThO/Th ratios below 0.5%. The laser beam diameter was set at 32 μm with an energy density of 5 J/cm2 and a repetition rate of 10 Hz. NIST 610 glass was applied as the bracketing external standard. A wide array of isotopes were analyzed, including 7Li, 9Be, 23Na, 24Mg, 27Al, 29Si, 39K, 44Ca, 45Sc, 49Ti, 51V, 52Cr, 55Mn, 57Fe, 59Co, 60Ni, 65Cu, 66Zn, 69Ga, 72Ge, 75As, 85Rb, 88Sr, 89Y, 90Zr, 93Nb, 95Mo, 107Ag, 111Cd, 115In, 121Sb, 133Cs, 137Ba, 139La, 140Ce, 141Pr, 146Nd, 147Sm, 151Eu, 157Gd, 159Tb, 163Dy, 165Ho, 167Er, 169Tm, 173Yb, 175Lu, 178Hf, 181Ta, 182W, 208Pb, 209Bi, 232Th, and 238U. Each spot measurement incorporated 20 s instrumental background, 20–30 s sample ablation, and 20 s washout time. Five to six spots devoid of inclusions were chosen for each sample ablation. A total of 91 analyses were conducted on the 17 faceted samples, using SILLS software for data reduction and tin as the internal standard (Guillong et al., 2008).
RESULTS
Gemological Properties. The gemological features of the 17 faceted samples and 10 rough stones (samples C-G1 to C-G10) show a range of hues, including brown, red, gray, and black. All were transparent, with RI values exceeding 1.78. SG values varied between 6.85 and 7.04, and this variability was broadly associated with the abundance of fractures and inclusions. Moreover, all samples showed an inert response to both long- and short-wave UV radiation. While most samples displayed no pleochroism, the brownish pink specimens exhibited moderate pleochroism of light brownish pink in one direction and pink in another. It is crucial to note that due to the rarity of cassiterite in gemological labs (Crowningshield, 1960; Gaievskyi and Iemelianov, 2012), its thermal conductivity (comparable to diamond’s) along with its electricity conductivity and birefringence could lead to the misidentification of faceted colorless stones as moissanite (Hyršl, 2002).
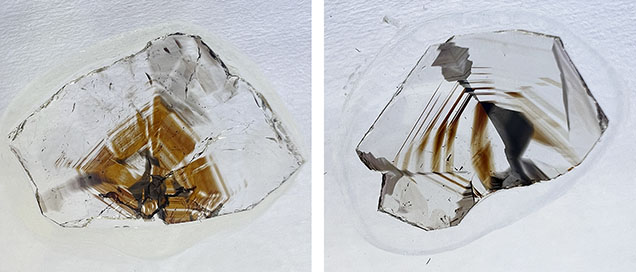

Microscopic Characteristics. Examination with a gemological polarizer revealed that some of the thin sections of cassiterite crystals exhibited twinning, which was also present in a few of the faceted stones. Irregularities in color, such as bands and domains, were relatively common in the Yunling cassiterite (figures 8 and 9). The samples consistently displayed alternating color bands, typically appearing brown, while the color domains were gray to black with irregular to regular outlines (figures 8 and 9B). The red sample exhibited dark stripes, with the red color distributed exclusively along two fractures (figure 9C). Under strong fiber-optic illumination, the black samples exhibited a deep brown or deep yellowish gray color.
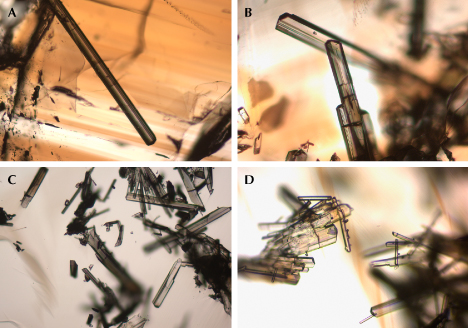

Microscopic observation, in combination with Raman spectroscopic analysis, revealed various mineral inclusions. The most prevalent inclusions were elongated and well-formed crystals (figure 10), identified as tourmaline by Raman spectroscopy (figure 11). The Raman bands of these tourmaline inclusions closely matched those of sodium-deficient schorl (Lensing-Burgdorf et al., 2017). These tourmaline inclusions were found as isolated occurrences (figure 10A) as well as clusters (figure 10, B–D). Further microscopic observation unveiled longitudinal striations on the column surface of these tourmaline crystals (figure 10, A and B), a characteristic feature of tourmaline.
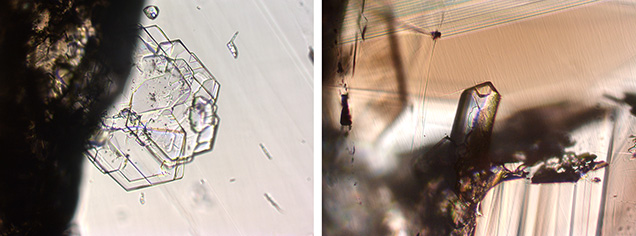

Some mineral inclusions observed in these samples were positively identified by Raman as beryl (figures 12 and 13). The beryl inclusions presented two distinct appearances: one platy (figure 12, left) and the other prismatic (figure 12, right).
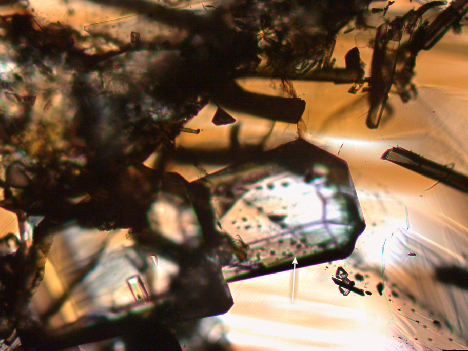

In addition, the Raman spectra of several solid inclusions such as the one shown in figure 14 matched the reference spectrum for muscovite (Wang et al., 2015) (figure 15), confirming their identification as mica. Differentiating between subgroups based on Raman spectra was challenging, as certain subgroups, such as muscovite and paragonite, displayed similar vibrational modes (Wang et al., 2015).
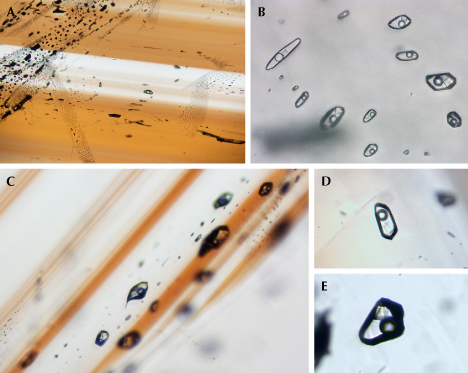

The Yunling cassiterite often displayed healed fissures containing fluid inclusions (figure 16). Upon closer examination, these fluid inclusions consistently showed a distinct negative morphology and consisted of three phases: a bubble, a liquid, and a transparent mineral (figure 16, B, D, and E). Although the transparent mineral showed no Raman signal, this is common for halite within fluid inclusions (Frezzotti et al., 2012). The cubic morphology strongly suggests that the mineral is halite. The consistent phase ratios between the halite and the volatiles indicate that halite is a daughter mineral formed through the crystallization of the cooling fluid inclusions. Halite-bearing inclusions were the most abundant type in Yunling cassiterite. Raman spectroscopy revealed that the liquid was water, while the vapor primarily consisted of carbon dioxide and methane, identified by the characteristic bands around 1383/1282 cm–1 and 2916 cm–1, respectively (Frezzotti et al., 2012) (figure 17).
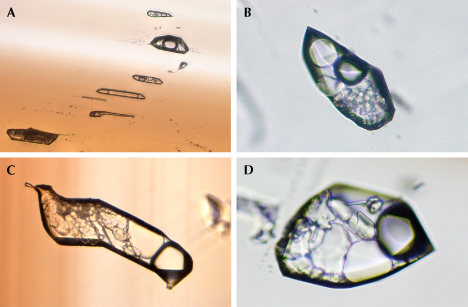

Multiphase, multi-solid inclusions, shown in figure 18, were occasionally encountered. These occurred either in healed fractures or as isolated inclusions. Raman analysis of a representative multi-solid inclusion indicated that the primary compositions of the liquid and vapor were water and carbon dioxide–methane, respectively (figure 19). Within this inclusion, five distinct solid phases were found. One of these solids exhibited characteristic bands at 1081 and 278 cm–1, indicating a carbonate, possibly calcite. The transparent mineral located in the bottom right corner of figure 19B did not display any Raman signal, suggesting the possibility of halite. The other three solid phases showed vibrations at 163–205, 186, and 138–163–233 cm–1, respectively (figure 19A), but we were unable to positively identify them based on the RRUFF database references.


Trace Element Compositions. The 17 faceted samples from Yunling were analyzed by LA-ICP-MS. Table 1 presents the representative trace elements for each sample, including their concentration ranges and corresponding averages. Other elements such as lithium, beryllium, sodium, zinc, and germanium were generally below or close to the detection limits. Notably, the high apparent values of indium were influenced by interference between 115Sn and 115In (Pavlova et al., 2015; Gemmrich et al., 2021). Therefore, these measurements are excluded from this report.

The titanium and iron contents ranged widely, from 8.08 to 1155 ppmw for titanium and from 25.7 to 425 ppmw for iron. The red sample had the highest iron values (see table 1). Titanium was more prevalent in black and light brown cassiterite. The concentrations of magnesium, aluminum, scandium, vanadium, chromium, antimony, cesium, and hafnium were mostly below 10 ppmw, with variations within each color group. The highest aluminum concentration, reaching 31.5 ppmw, was observed in the red sample. Among the various color groups, vanadium exhibited the highest concentration in the light brown samples (19.5 ppmw) and brownish pink samples (up to 18.8 ppmw). Niobium and tungsten showed significant variation, ranging from 0.04 to 911 ppmw for niobium and from below detection limit to 327 ppmw for tungsten (table 1). The black cassiterite samples had the highest concentrations of tungsten (115–327 ppmw) and niobium (180–911 ppmw) (figure 20). The black samples also contained higher concentrations of uranium (6.48–17.8 ppmw) and zirconium (3.58–43.1 ppmw) than the other color groups (table 1). However, it is worth noting that the zirconium maximum was almost as high in the light brown (33.7 ppmw) and brownish pink (22.1 ppmw) samples. Cobalt and nickel compositions remained relatively constant across all color groups, with ranges of 8.29–10.1 ppmw and 56.8–69.3 ppmw, respectively (figure 20).

UV-Vis-NIR Absorption Spectra. The UV-Vis-NIR spectra representative of the seven color groups are shown in figure 21 (left). A notable characteristic of near-colorless, light brown, brownish pink, and light gray cassiterite was a strong absorption band that shifted from the near-UV region (~350 nm) to the violet region (~400 nm). The brownish pink variety also showed a broad band centered around 490 nm. In contrast, the light brown and brown cassiterite exhibited increasing absorption from the red to violet regions, while the black samples displayed a relatively uniform absorption across the entire visible light range. The red cassiterite sample exhibited a broad transmission window spanning from 570 to 800 nm. Notably, the Vis-NIR reflectance spectrum of the red cassiterite closely resembled that of hematite and, to a lesser extent, goethite (figure 21, right).
DISCUSSION
Correlation Between Trace Elements and Colors. Gem materials derive their colors predominantly from dispersed metal ions, such as Cr3+, Cu2+, and Co2+; their colors can also arise from combinations of ions, such as the intervalence charge transfer species Fe2+–O–Fe3+ in beryl, or color centers like the GR1 center in diamond (Fritsch and Rossman, 1987, 1988a). In some cases, the presence of a colored mineral within the host can also contribute to a gem’s color (Fritsch and Rossman, 1988b). However, the color-producing mechanism for cassiterite is rarely described, partly due to the scarcity of gem cassiterite with various colors.
Previous studies have attempted to establish the correlation between color variations and trace element compositions in natural cassiterite, leading to varying conclusions. Mossbauer spectroscopy has shown that cassiterite’s color bears no relationship with the total iron composition but is instead influenced by the Fe2+/Fe3+ ratios; the dark (black and brown) zones contain higher Fe2+/Fe3+ ratios than the colorless ones (Grubb and Hannaford, 1966). On the other hand, some studies have shown that the dark zones contain higher concentrations of iron, niobium, tantalum, tungsten, and titanium (Goncharov and Filatov, 1971; Ollila, 1986; Nambaje et al., 2020). In certain cases, uranium (Swart and Moore, 1982) and uranium-tungsten (Guo et al., 2018) have been proposed as possible factors influencing the color, with higher contents corresponding to darker (dark brown) color zones. However, these interpretations are based solely on the geochemical perspective, and no optical absorption spectroscopy studies have been conducted.
Meanwhile, the color mechanism of impurity-doped synthetic cassiterite, widely used as a pigment in the ceramics industry, has undergone extensive research. A violet color has been linked to the presence of Cr4+, generating a characteristic band at 550 nm (Lopez-Navarrete et al., 2003; Serment et al., 2019). The contribution of Cr3+ and/or Cr4+ to the violet hue has also been suggested, with Cr3+ in cassiterite displaying characteristic bands at 650 and 470 nm (Ishida et al., 1987). Investigation by Matsushima et al. (2008) into dark brown films suggests that color origin may stem from chloride impurities and/or oxygen vacancies. Moreover, the incorporation of high field strength elements into cassiterite can alter its color appearance. For example, antimony imparts a light gray hue (Tena et al., 2005) or black (Kojima et al., 1996), attributed to charge transfer interactions between Sb3+ and Sb5+ within the matrix. These insights underscore the intricate nature of cassiterite’s color mechanism, dictated by the interplay of the impurity species and their respective oxidation states.
Figure 20 shows common chromophores in gem materials (iron, nickel, cobalt, titanium, vanadium, and chromium), along with potential color-producing elements for cassiterite (tungsten, tantalum, niobium, and uranium). The consistently low cobalt and nickel concentrations across the seven color groups imply a limited role in cassiterite coloration. Notably, the iron concentrations in one near-colorless sample (sample C1) stood out from the other (sample C2; see table 1 and figure 20). Further microscopic examination of sample C1 revealed that high iron concentrations were associated with colorless areas rather than dark brown or brownish pink areas. This implies that iron does not significantly contribute to the color of pink and brown samples, as brownish pink sample C8 and light brown sample C3 were comparable in iron content to near-colorless sample C2, which had the lower iron content of the two near-colorless samples (figure 20). Although Guo et al. (2018) found higher uranium and tungsten compositions in the dark brown zones than in the light yellow domains, their low concentration in both the brown group and the light brown group suggests a minimal influence on the brown color (table 1; figure 20). In other words, impurities other than uranium-tungsten may be responsible for the brown color of Yunling cassiterite. Noticeably elevated tungsten contents are frequently found in the black cassiterite group (avg. 183 ppmw; table 1; see also Huang et al., 2023), suggesting that tungsten may contribute to the black coloration. This is supported by Zhou et al. (2018), in which doped tungsten was shown to enhance the visible light absorption of cassiterite. It is important to note that tungsten impurities in cassiterite often exist in hexavalent and tetravalent states (Möller et al., 1988; Bennett, 2021). While W4+ does not impact the color of cassiterite, W6+ can contribute to the black color through tungsten-oxygen charge transfer (Nomiya et al., 1987).
Further UV-Vis-NIR spectroscopic analysis revealed distinct absorption spectra among different colors of cassiterite (figure 21, left). Absorptions related to Cr3+ (650 and 470 nm) or Cr4+ (550 nm) were not observed in any of the samples. In brownish pink cassiterite, a broad absorption band centered at approximately 490 nm might account for its pink color; however, similar bands have not been previously reported, and the specific nature of this 490 nm band remains unclear. The absorption spectra of light brown and brown cassiterite, displaying a gradual decrease in absorption strength with wavelength, resembled the dark brown SnO2 film presented in figure 3 of Matsushima et al. (2008). According to those authors, the dark brown coloration may stem from impurities such as chloride and/or oxygen vacancies. Oxygen vacancies are commonly found in magmatic-hydrothermal cassiterite, as reported by Grigor’yev et al. (1986), and these samples typically display a dark brown or black coloration that becomes more intense with an increased number of oxygen vacancies. Therefore, the origin of the brown (and possibly light brown) color in cassiterite from Yunling could be linked to the presence of oxygen vacancies. The color of the black cassiterite, which is influenced by tungsten, could also be associated with the presence of oxygen vacancies. The red cassiterite from Yunling exhibited a broad transmission at approximately 710 nm (figure 21, left). Microscopic examination revealed highly heterogeneous color distribution in the analyzed red cassiterite, in which the red color was concentrated exclusively in the fractures (figure 9C). Hence, iron oxide staining in the fractures, rather than trace elements or lattice defects, was likely responsible for this coloration. This inference is supported by its Vis-NIR reflectance spectrum (figure 21, right), which is highly consistent with that of hematite, a common red-colored iron oxide found in soil and sediments.
Substitutional Mechanism of Trace Elements. Cassiterite possesses a tetragonal lattice structure analogous to that of rutile, allowing the incorporation of various trace elements such as iron, vanadium, scandium, titanium, tungsten, and uranium (Farmer et al., 1991; Tindle and Breaks, 1998; Bennett et al., 2020). However, the occurrence and substitution mechanisms of these trace elements are not well constrained and may vary among deposits (e.g., Gemmrich et al., 2021; He et al., 2022). The incorporation of trace elements into cassiterite depends largely on ionic charge, radius, and coordination, allowing compatibility with a wide range of elements in different valence states (e.g., Grubb and Hannaford, 1966; Möller et al., 1988; Murciego et al., 1997). Tetravalent elements such as Ti4+, Zr4+, and Hf4+ can directly substitute for Sn4+ without requiring additional ions for charge balance. In contrast, trivalent and pentavalent elements require other elements for charge compensation, as seen in examples such as 3Sn4+ ↔ 2(Ta, Nb)5++ Fe2+ or 3Sn4+ ↔ W6++ 2Fe3+.

In figure 22 we use the unit apfu (atoms per formula units) and the conversion from ppmw to apfu as follows:

The Fe-Al (figure 22A) and Fe-Ga (figure 22B) pairs yield a positive relationship in the Yunling cassiterite samples. This positive correlation between iron and aluminum is likely due to the similarity in trivalent ion radii (Shannon, 1976). Similarly, the Yunling cassiterite exhibited a positive correlation between iron and gallium that is analogous to what has been observed in many granite-associated hydrothermal cassiterites (e.g., He et al., 2022). This correlation can be explained by the coupled substitution of 2Sn4+ ↔ Fe3+ + Ga5+. Furthermore, the positive relationship between scandium and vanadium (figure 22C) implies that vanadium is in a valence state of +5, considering that scandium occurs only in a +3 valence state in geological conditions. Therefore, a substitution mechanism of 2Sn4+ ↔ Sc3+ + V5+ is favored.
It is well established that niobium and tantalum are incorporated into cassiterite in the pentavalent state through a coupled substitutional mechanism involving iron (Möller et al., 1988; Neiva, 1996). Figure 22D shows a marked deviation from the 2:1 line in most of the sample analyses, implying a significant iron excess. This surplus iron indicates additional substitution in the samples. Considering a broader range of trivalent (aluminum, scandium, iron, gallium, chromium, and antimony) and pentavalent (vanadium, niobium, and tantalum) cations dominant in cassiterite, the data would be expected to plot along the 1:1 ratio. However, there appears to be a deviation indicating a significant excess of trivalent cations (figure 22E). The low concentrations of lithium, mostly below detection limits, make its compensation impossible. In order to balance the uncompensated trivalent cations, potential compensating cations could be H+ (Tindle and Breaks, 1998; Mao et al., 2020) or interstitial Sn2+ (as proposed by Cohen et al., 1985). Moreover, the black samples in figures 22D and 22E stand out from the other color groups on these plots. Recent studies have shown that individual cassiterite crystals exhibit distinct chemistries within each zone that appears dark in cathodoluminescence imaging, driven by specific substitution mechanisms (Bennett, 2021; Huang et al., 2023). Therefore, the observed variations observed in figures 22D and 22E could be attributed to cathodoluminescence-dark zones in the black samples (Huang et al., 2023).
Geographic Origin Determination. Although large euhedral cassiterite of gem quality from the Viloco mine in Bolivia was documented more than 20 years ago (Hyršl, 2002), comprehensive gemological properties remained lacking. Nevertheless, trace element spectra of cassiterite from the Viloco mine (Gemmrich et al., 2021) allow comparative analysis with the Yunling deposit (table 1).

Box and whisker plots in figure 23 illustrate the concentration of 12 selected elements, revealing broader ranges for elements such as tantalum, uranium, cobalt, and titanium in Viloco cassiterite compared to Yunling. Yunling cassiterite typically has a lower iron concentration, but the ranges overlap (as they do for all elements). The low iron concentration of Yunling cassiterite (generally <200 ppmw) is atypical of granite-related cassiterite deposits worldwide (Hennigh and Hutchinson, 1999; Guo et al., 2018; Chen et al., 2019). However, a granite-related petrogenesis has been suggested for this deposit (Xiao et al., 2022), supported by the vein occurrence and mineralogy comparable to other granite-related deposits. High-salinity fluid inclusions (figure 16) provide further evidence for its magmatic-hydrothermal origin. To our knowledge, the low iron content in Yunling cassiterite is unique. Iron incorporation in the cassiterite lattice typically involves other cations through a coupled substitutional mechanism (e.g., Möller et al., 1988); hence, the low iron content in Yunling cassiterite may be related to the low content of other cations such as niobium, tantalum, and gallium. Notably, the concentrations of cobalt and nickel are consistent in cassiterite from Yunling, regardless of color, while their concentrations in Viloco cassiterite are highly variable, even within a single sample (Gemmrich et al., 2021). For example, in sample Vil2-sn-b examined by Gemmrich et al. (2021), the concentrations of cobalt and nickel varied by an order of magnitude, from 8 to 77 ppm and 45 to 416 ppm, respectively. Therefore, multiple spot measurements of cobalt and nickel concentrations are valuable in separating cassiterite from Yunling and Viloco.

Figure 24 displays discrimination plots for Yunling compared to Viloco for Cr-V, U-W, Nb-Fe, and Ni-Sb. Significant overlap is observed in the Cr-V plot (figure 24A), undermining its effectiveness for discrimination. Minor overlap between uranium and tungsten points in Yunling and Viloco cassiterite is also observed in figure 24B. Comparing iron concentrations (figure 24C) and antimony concentrations (figure 24D) in Yunling cassiterite with those in Viloco cassiterite helps to distinguish their origin.
Cassiterite samples from both deposits contain healed fissures and tourmaline needles (Hyršl, 2002), but the presence of beryl and mica inclusions is typical for Yunling and Viloco.
CONCLUSIONS
The Yunling area in Yunnan Province, China, is among the few sources of gem cassiterite, producing mineral specimens since the 1980s. Despite the influx of faceted stones on the Chinese market in recent years, a lack of knowledge of their gemological properties and trace element chemistry exists, a gap this article addresses.
A detailed gemological investigation shows various hues of cassiterite, including near-colorless, light brown, brown, brownish pink, red, light gray, and black. Color bands displaying an oscillatory nature and irregular gray-black color domains are common. Notable mineral inclusions are tourmaline, beryl, and mica. Three-phase fluid inclusions, frequently found in healed fissures, consist of liquid, vapor, and a daughter mineral, probably halite.
Quantitative chemical analysis using LA-ICP-MS showed that the trace elements in the seven color groups of Yunling cassiterite are dominated by titanium (avg. 343 ppmw) and iron (avg. 122 ppmw). Additionally, black samples exhibited significant enrichment in tungsten (avg. 183 ppmw) and uranium (avg. 12 ppmw). The UV-Vis-NIR absorption spectra of the various samples exhibited significant differences, illustrating different sources for the various colors. The black color can be attributed to the presence of trace element tungsten and oxygen vacancies, while the brown color may result from the presence of oxygen vacancies alone. The color of the red sample could be attributed to the contribution of iron oxide staining within fractures, so this color is not inherently from the host crystal. The underlying cause of pink color remains unresolved and requires further investigation.
Yunling cassiterite typically shows a narrower range of trace element concentrations (e.g., titanium, cobalt, nickel, and chromium) than samples from the renowned deposit in Viloco, Bolivia. Trace element plots of Sb-Ni and Fe-Nb can efficiently discriminate Yunling and Viloco cassiterite. The refinement of geographic origin determination for cassiterite, through additional reliable samples and data from this and other sites, remains an area for further study.


