A Gemological and Spectroscopic Study with Mobile Instruments of “Emeralds” from the Coronation Crown of Napoleon III
ABSTRACT
Forty-five “emeralds,” formerly set in the coronation crown of Napoleon III, were studied using nondestructive mobile spectroscopic and gemological means. Adorned with emeralds, diamonds, and gold, the crown was created in 1855 by royal jeweler Alexandre Gabriel Lemonnier but dismantled in 1887 for the auctioning of the French crown jewels. Some of the emeralds were donated to the École des Mines (Paris School of Mines, now known as Mines Paris - PSL) in 1887, prior to the auction. Our examination revealed that 41 out of 45 gems were indeed natural emeralds, presenting no evidence of clarity enhancement. Their gemological characteristics and age suggest a Colombian provenance. The other four samples were determined to be artificial glass containing iron and/or copper and possibly other chromophores. These glass imitations could have been set when the crown was created or shortly thereafter. This study is part of an effort to examine gemstones of historical meaning and significance worldwide.
The collection of the French crown jewels was established on June 15, 1530, by Francis I and enriched by later kings and emperors, such as Henry II, Henry IV, Louis XIV, Napoleon I, Louis XVIII, and Napoleon III. This important collection of loose gemstones and high-end jewelry included many significant gems: the Regent, Grand Sancy, and French Blue (later Hope) diamonds; the Grand Sapphire; and the Côte de Bretagne red spinel (see Bapst, 1889 and Morel, 1988 for details on the collection and its history). It is worth mentioning that most of the jewels were kept as individual stones and used in custom settings designed for each new sovereign, and then dismantled again when a successor came to power.
After the end of the French Empire, the crown jewels were exhibited twice in Paris, in 1878 at the Exposition Universelle (World’s Fair) and in 1884 in the State Room at the Louvre. Both exhibitions were heavily guarded and attracted large crowds of admirers. However, the popularity of the two events did not prevent the unprecedented sale of this national treasure.
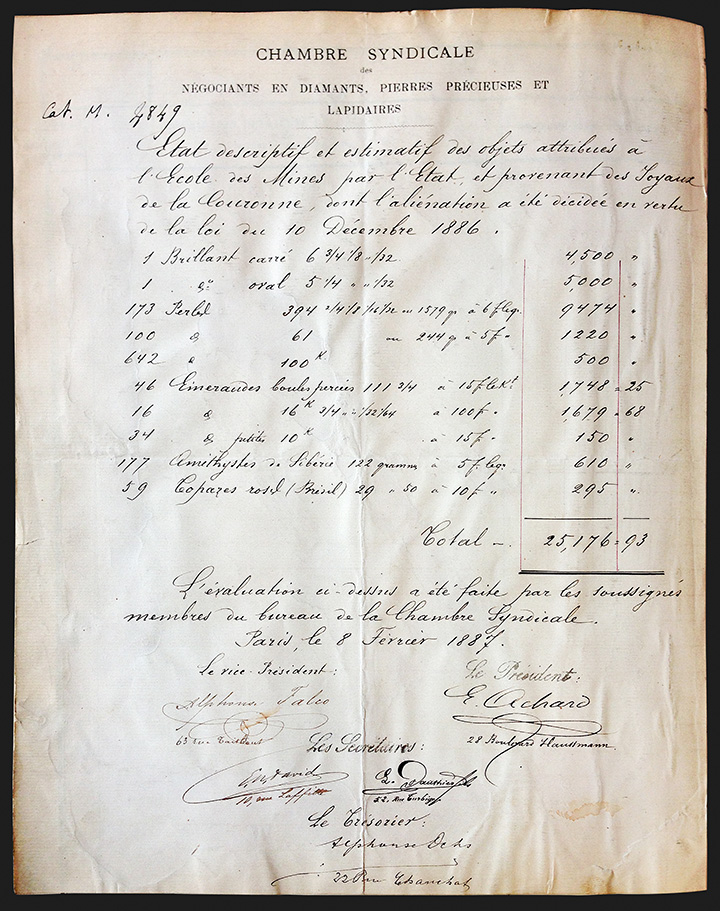
During the French Third Republic, most of the crown jewels were dismantled and sold at an auction at the Louvre, held May 12–23, 1887. The auction was intended to get rid of these symbols of royalty and empire. Some unset gems, however, were put aside and given to various French museums, including the French Natural History Museum, the Louvre, and the École des Mines, all in Paris. On February 8, 1887, the École des Mines received two small diamonds, 915 pearls, 96 Colombian emeralds, 177 Siberian amethysts, and 59 Brazilian pink topazes (figure 1). For additional historical background on the French crown jewels, see Morel (1988).
Since the late twentieth century, the Louvre has bought back a few pieces of jewelry, which are on exhibit at the Apollo Gallery and in the Apartments of Napoleon III. The National Museum of Natural History in Paris displays its loose gems from the French crown jewels as part of the “Earth’s Treasures” exhibit. Most of the other gems and jewels are still in private collections, though a few have found their way into museums, including the Napoleon diamond necklace (Gaillou and Post, 2007) and the Hope diamond (Patch, 1976; Balfour, 1987; Post and Farges, 2014) at the Smithsonian Institution in Washington, DC.
This article presents the results of research conducted on emeralds formerly mounted in Napoleon III’s coronation crown. It follows previous scientific articles dedicated to the study of historic gems in museums worldwide (e.g., Bosshart, 1989; Kane et al., 1990; Fritsch et al., 2007; Gaillou and Post, 2007; Gaillou et al., 2010, 2012, 2022; Galopim de Carvalho, 2014; Post and Farges, 2014; Farges et al., 2015). These gems from the crown were kept in the vault of the museum of the École des Mines in Paris until 2016, when the museum opened an exhibition of gems from the French crown jewels. The present paper is part of an ongoing project on the study of the gems previously adorning historic jewels, led by the French Gemmological Laboratory (LFG) and the Museum of Mineralogy, Mines Paris - PSL, which owns the gems.
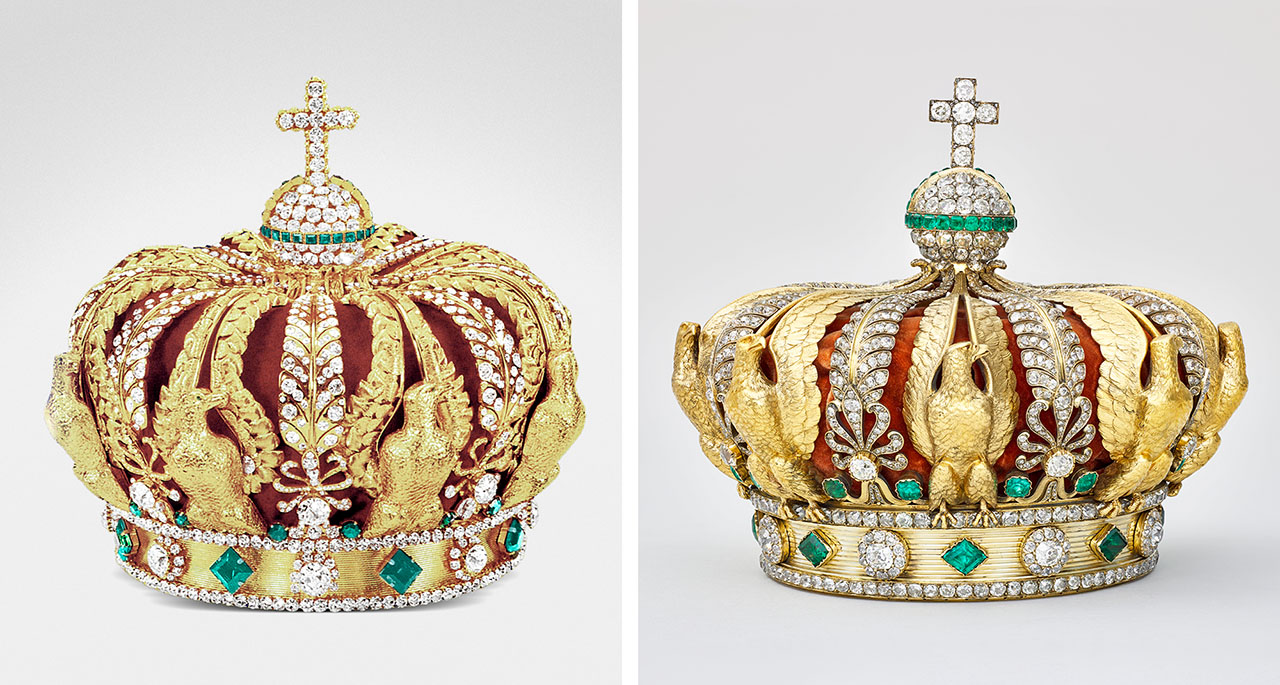
The crown (figure 2, left) was created in 1855 by royal jeweler Alexandre-Gabriel Lemonnier and presented at the “Exposition Universelle” in Paris the same year. Lemonnier’s very similar crown for Empress Eugénie is shown in figure 2 (right). Napoleon III’s crown was adorned at the bottom part with eight large emeralds ranging from 14.5 to 23.7 ct (with a total weight of more than 150 carats) as well as eight large diamonds weighing 17.00 to 26.33 ct that were previously mounted in another royal crown. These diamonds included the 19.07 ct Grand Mazarin, the 19.22 ct De Guise, and the 25.53 ct Fleur-de-Pêcher. Fifty smaller “emeralds” were also incorporated: 34 rectangular step-cut stones forming an equator around the globe atop the crown (and topped with a diamond cross) with a total weight of 10.03 carats, and 16 round and oval brilliant-cut stones circling the midsection, with a total weight of 17.26 carats. Morel (1988, p. 338) notes that shortly after the crown’s creation, the eight large diamonds were removed and later used in other jewels of Empress Eugénie, replaced by “strass” (artificial glass, possibly containing lead) imitations. Morel also noted that the emeralds were left set in the crown.
Five years after the fall of the empire, the eight large emeralds were restituted to Empress Eugénie on October 5, 1875. In 1887, Napoleon III’s crown was melted down and the stones were separated into different suites. During the auction of the French crown jewels in May 1887, the eight large diamonds were sold to the highest bidder (the diamond cross was sold to the jeweler Boucheron earlier that year). The 50 smaller “emeralds” were part of the donation to the École des Mines. Today, 33 of the 34 gems from the upper part of the crown as well as 12 of the 16 gems from the midsection are cataloged in the Museum’s collection, and these are presented below.
MATERIALS AND METHODS
Examined here are the 45 green stones, reportedly emeralds, that were donated during the Third Republic’s historical deposit of 1887 into the collection of the École des Mines (formally the École Normale Supérieure des Mines de Paris, or ENSMP), now called Mines Paris - PSL. The catalog numbers of the school’s mineral, gem, meteorite, and rock collection still bear the initials “ENSMP,” all entered under a single catalog number: all entered under a single old catalog number: M. 4849.
This study investigates some of the 96 emeralds that were part of this original donation; the 46 emerald beads are excluded. We only focus on the gems mentioned as “16 emeralds of 16.79 carats” and “34 emeralds of 10.03 carats” in total weight (see again figure 1), as these can be traced back to the coronation crown of Napoleon III. Among the 50 emeralds donated in 1887, 45 of them are still in the museum’s collection, the curators having no record of the remaining five.


As the ENSMP collection has evolved over the 135 years since the gems from the crown jewels arrived, the donation that was deposited under a single reference number was dispatched into several catalog numbers. The 50 emeralds from Napoleon III’s crown were divided into three series. The first series consists of the previously mentioned 34 emeralds from the top part of the crown, under the name ENSMP 69880, 33 of which are still in the collection (figure 3 and table 1; note that sample ENSMP 69880_5 is missing). The second series of 16 emeralds from the midsection of the crown was split into at least two catalog numbers—four stones under ENSMP 69881 and eight under ENSMP 69866 (figure 4 and table 1)—while the last four remain missing. The reason for splitting this second series is not clear, but as we will see later, series ENSMP 69881 has characteristics unlike the others.

As the set of 45 samples is considered a national treasure, the project had to be conducted on-site at the Museum of Mineralogy, Mines Paris - PSL. Because of this constraint, the samples were studied using LFG’s mobile spectrometers as well as classical gemological tools. The samples and their dimensions are listed in table 1. All samples were examined with classic gemological tools. Observation was performed using a Zeiss Stemi 508 binocular microscope (magnification up to 80×) equipped with a fiber-optic light source and an incorporated camera to acquire photos all mounted on an Eickhorst Gemmaster base. Luminescence was examined using a 6-watt ultraviolet lamp (Vilber Lourmat VL-6.LC) with long-wave UV (365 nm) and short-wave UV (254 nm) light, equipped with a CN-6 darkroom (10 cm distance between the sample and the lamp). Refractive indexes were taken with a refractometer and mass and density with a hydrostatic balance.
Raman and photoluminescence (PL) spectra were obtained using a mobile Raman spectrometer (Magilabs GemmoRaman-532SG) with a 532 nm laser excitation and spectral resolution of 11 cm–1, ranging for Raman spectra from 200 to 2000 cm–1 (with 1 second exposure time and 4 accumulations) and for PL spectra from 540 to 760 nm (0.3 to 0.4 second exposure time and 30 accumulations). All spectra were acquired with the laser pointing at the table, the flattest part of the stone. Calibration of the Raman spectrometer was made with a diamond, using its 1331.8 cm–1 Raman line. Due to this study requiring the use of a mobile instrument, the spectral resolution was over 10 cm–1. This precluded us from reaching a conclusion regarding the alkali content, which would have required the use of the exact position and full width at half maximum of the band at 1070 cm–1 to differentiate emeralds containing either low or high concentrations of alkali elements (Huong et al., 2014; Bersani et al., 2014; Jehlička et al., 2017; Karampelas et al., 2019). Indeed, in order to obtain the real shape of this band, relatively high spectral resolution (<2 cm–1) must be used in the acquisition of the Raman spectra. Moreover, the spectral resolution of the instrument could also affect the exact position of the PL bands. For example, if the spectral resolution is not optimal, the real shape of the band is not obtained and it appears broader and in slightly shifted positions. The suggestion that the exact position of the Cr3+ R1 line can give information regarding an emerald’s country of origin (Moroz et al., 2000; Thomson et al., 2014) should be considered with caution. Visible/near-infrared (Vis-NIR) spectra were acquired from 365 to 1000 nm using a mobile instrument (0.05 to 0.10 seconds acquisition time and 50 accumulations) with an integrating sphere (Magilabs Gemmosphere). Fourier-transform infrared (FTIR) spectra were obtained with a mobile instrument (Bruker Alpha II) in the 400 to 8000 cm–1 range (4 cm–1 spectral resolution and 100 scans) using a DRIFT accessory as a beam condenser (Hainschwang et al., 2006).
RESULTS AND DISCUSSION
Gemological Properties and Appearance. Dimensions, weights, and shapes and cutting styles of the 45 examined samples are presented in table 1. The first suite of 33 gems (ENSMP 69880) consists of rectangular step cuts, weighing from 0.180 to 0.408 ct (figure 3). The total weight of the 33 samples from series ENSMP 69880 is 9.919 carats instead of the 10.030 carats mentioned in the archives, registering all 34 original samples. The second suite (ENSMP 69866) is composed of eight roundish brilliants (one with a more oval shape), weighing from 0.854 to 1.339 ct, for a total weight of 8.431 carats (figure 4A). The last suite (ENSMP 69881) is composed of four round brilliants weighing from 0.703 to 0.939 ct (figure 4B), for a total weight of 3.49 carats.
All 33 rectangular gems of suite ENSMP 69880 (figure 3) and all eight roundish gems of suite ENSMP 69866 (figure 4A) presented a vivid green color. The four round-shaped stones from suite ENSMP 69881 displayed instead an intense green with a slightly yellowish tint (figure 4B). The refractive index of samples from series ENSMP 69866 and ENSMP 69880 varied from 1.570 to 1.588, and their specific gravity values from 2.60 to 2.75, consistent with beryl. The color observed for those samples was consistent with the emerald variety of beryl. All samples were inert under UV lamp excitation, except for one (ENSMP 69866_3) that exhibited a weak red fluorescence to long-wave UV only. This difference in fluorescence behavior could be explained by a slightly larger ratio of chromium to iron in this emerald; fluorescence is present when the ratio is significant and becomes less intense with a decrease in chromium to iron ratio (Bosshart, 1991b).
Samples from series ENSMP 69881 presented completely different characteristics: a refractive index of about 1.64, a specific gravity between 3.56 and 3.78 (depending on the stone), and a chalky yellowish fluorescence that was weaker to long-wave UV than to short-wave UV. The RI, SG, and UV reaction are similar to those observed in artificial glass containing lead (Nassau, 1980; Webster and Anderson, 1983).

Macroscopic and Microscopic Observations. Standard macroscopic observation revealed surface-reaching cracks in some samples (figure 5). This could be attributed to multiple uses of gems in different jewelry pieces over time. This practice of reusing gemstones from the French crown jewels, sometimes even recutting them, is well known (e.g., Bapst, 1889; Morel, 1988). The purpose was to create contemporary pieces of jewelry in style with the era, which then could be used by the new ruler. Interestingly, sample ENSMP 69881_3 shows a conchoidal fracture (figure 5D).


Under the microscope, samples from suites ENSMP 69866 and ENSMP 69880 (41 of the 45 studied samples) presented natural features such as multiphase inclusions with jagged outlines, color zoning, transparent crystals (possibly carbonates), and gota de aceite (Spanish for “drop of oil”) patterns (figures 6 and 7). Inclusions with jagged outlines are observed in natural emeralds from Colombia and occasionally from Afghanistan, China, and a small occurrence in Zambia (specifically from Musakashi and not the more productive Kafubu deposits), as well as mines of more academic interest (Bosshart, 1991b; Saeseaw et al., 2014, 2019; Schmetzer, 2014; Krzemnicki et al., 2021). The gota de aceite appearance such as that observed in ENSMP 69866_2 (figure 7) is documented in emeralds from Colombia but seldom observed in emeralds from other origins (Ringsrud, 2008; Hainschwang, 2010; Fritsch et al., 2017). These structures display octagonal color zoning due to fibrous growth at a fast growth rate, followed by a later growth episode, possibly slower, which filled the space between the fibers. The gota de aceite appearance is most likely due to light scattering at the irregular interface between the two growth episodes (Fritsch et al., 2017). No indications of treatment, such as the clarity enhancement applied to emerald since well before the fourteenth century (Johnson et al., 1999; Kiefert et al., 1999), were observed microscopically in any of these samples. The four samples from suite ENSMP 69881 presented no mineral inclusions. Only one displayed “flow patterns” (figure 8), along with bubbles characteristic of glass (Webster and Anderson, 1983; Gübelin and Koivula, 1986).

Raman Spectroscopy. Raman spectra of three representative samples, from suites ENSMP 69866 and ENSMP 69880, are presented in figure 9A. Spectra showed bands typical of beryl. The vibration at around 685 cm–1 is linked to Be-O stretching; at around 1070 cm–1, the vibration is related to Si-O and/or Be-O stretching, along with a less intense band at around 1010 cm–1 due to Si-O stretching. The weaker bands between 200 and 600 cm–1 are linked to Si6O18 ring vibrations (Adams and Gardner, 1974; Hagemann et al., 1990; Kim et al., 1995; Moroz et al., 2000; Bersani et al., 2014; Jehlička et al., 2017). The spectra presented some differences in the relative intensities of the Raman bands (see again figure 9A). These result from the different crystallographic orientations in which the gems are cut and the spectra acquired. The band at around 685 cm–1 is the most intense, with the bands at around 1010 and 1070 cm–1 having a similar intensity (e.g., sample ENSMP 69880_3, red line in figure 9A) when the spectrum is acquired with the laser beam parallel to the c-axis of the crystal. When spectra are acquired with the laser perpendicular to the c-axis of the crystal (e.g., sample ENSMP 69866_1, black line in figure 9A), the band at 1070 cm–1 is slightly more intense than that at 685 cm–1, while the band at around 1010 cm–1 is significantly less intense (Moroz et al., 2000; Bersani et al., 2014; Jehlička et al., 2017; Karampelas et al., 2019). All samples from suites ENSMP 69866 and ENSMP 69880 (representing 41 of the 45 samples) showed the beryl-related Raman bands, which only differ in relative intensity.
Raman spectra of all samples from suites ENSMP 69866 and ENSMP 69880 presented strong luminescence phenomena above 2000 cm–1 (i.e., from the yellow to the red part of the electromagnetic spectrum). For that reason, it was impossible using this instrument to study the type I water (lacking a nearby alkali ion) and type II water (with alkali ions nearby) vibrations appearing at around 3609 and 3598 cm–1, respectively (Huong et al., 2010; Bersani et al., 2014; Jehlička et al., 2017; Karampelas et al., 2019).
Raman spectra of two of the four samples from suite ENSMP 69881 are presented in figure 9B. The spectra showed broad bands at slightly different positions, similar to those observed in glassy silicates, with Si-O stretching and bending and corresponding Raman bands at around 1000 cm–1 and 500 cm–1, respectively (Colomban et al., 2006). Glasses are relatively poor Raman scatterers, and the signal-to-noise ratio of the mobile Raman instrument did not allow us to draw clear conclusions; however, the spectra are similar to those observed in lead glass (Colomban et al., 2006; Robinet et al., 2006; Ben Kacem et al., 2017). This kind of glass (e.g., “flint glass,” which may display a relatively high refractive index—up to 2.00, depending on lead content—and dispersion) is known to have been manufactured for several centuries (Ben Kacem et al., 2017).

Photoluminescence Spectroscopy. PL spectra of all ENSMP 69866 and ENSMP 69880 samples presented a sharp band at around 680 nm and another more intense sharp band at around 684 nm. These emission bands are linked to Cr3+ R2 and R1 lines, respectively, in the beryl structure. They are accompanied by a broad band in the red part of the visible range, centered around 710 nm (see two examples in figure 10A), possibly also linked to chromium (Wood, 1965; Moroz et al., 2000; Thomson et al., 2014). Positions and relative intensities of the R lines presented some orientation effects (see again figure 10A). In the studied samples, the R1 line ranged from 683.7 to 683.9 nm, similar to some emeralds from Colombia as well as some from Russia and Afghanistan (Thomson et al., 2014; Karampelas et al., 2019).
The four ENSMP 69881 samples presented a broad PL band at 560 nm with a shoulder at around 580 nm, less intense for sample ENSMP 69881_2 (figure 10B, black line), along with a broader band centered at around 700 to 710 nm, with different relative intensities for the two samples (see again figure 10B). The bands in the green part are possibly due to oxygen deficiency–related centers (Skuja, 1998). In the red part of the spectra, the observed bands might be due to non-bridging oxygen-hole centers in glass (Sakurai et al., 1999). Green luminescence under UV light can be found in glass imitations of gems (Webster and Anderson, 1983).

Visible/Near-Infrared (Vis-NIR) Spectroscopy. Two typical Vis-NIR spectra of samples from suites ENSMP 69866 and ENSMP 69880 are shown in figure 11A. All 41 stones from these suites presented similar spectra. The broad absorptions at around 430 and 610 nm are both linked to Cr3+ and V3+ in beryl. The two sharp bands of weak intensity at around 680 nm are due to Cr3+ R1 and R2 lines. No absorptions linked to iron are observed in the near-infrared part of the electromagnetic spectrum (Wood and Nassau, 1968; Bosshart, 1991b; Saeseaw et al., 2014, 2019; Schmetzer, 2014). Most natural emeralds from Colombia, as well as some from Afghanistan and a small occurrence recently discovered in Zambia, present spectra without any absorption linked to iron, or with low- to medium-intensity bands linked to iron in the NIR region (Bosshart, 1991b; Saeseaw et al., 2014, 2019; Giuliani et al., 2019; Giuliani and Groat, 2019; Karampelas et al., 2019; Krzemnicki et al., 2021). The slight differences in position and relative intensity of the absorption bands are also due to crystallographic orientation effects. The small sharp band at around 960 nm is due to the presence of water in beryl.
Figure 11B presents two Vis-NIR spectra of the suite of four ENSMP 69881 specimens, all four spectra being similar in shape. A large absorption band centered at around 800 nm due to Fe2+ and/or Cu2+ is observed, along with a total absorption (cut off) from 380 to 400 nm due to Fe3+ (or Fe3+-S2−) and a transmission window in the green part of the visible range at around 510 nm (Schreurs and Brill, 1984; Carl et al., 2007; Meulebroeck et al., 2010, 2011). Using this mobile Vis-NIR instrument, a clear image of the absorption in the NIR (above 1000 nm) and in the UV (below 365 nm) cannot be obtained to better characterize the exact cause of the color. However, we observed no absorption bands due to elements used for recent glass coloration. For example, the use of chromium began after the second half of the nineteenth century, and it was not observed in any of the studied glasses (Meulebroeck et al., 2016).

Infrared (IR) Absorption Spectroscopy. Figure 12A presents a typical FTIR spectrum of a sample from series ENSMP 69866 (black line). At around 3500 cm−1, a total absorption is observed, which is due to vibrations linked to the stretching of water molecules in the beryl structure. The combination water bands are situated in the range of 4500 to 8000 cm−1. For example, a series of bands at around 5270 cm−1 due to type I water (without an alkali ion nearby) and type II water (with alkali ions nearby) can be observed (Wood and Nassau, 1967, 1968). In the NIR region at about 1400 nm (7142 cm−1), the absorption is due to type I water; at around 1408 nm (7102 cm−1), the band is due to type II water (figure 12, A and B). Using the mobile FTIR instrument, the signal-to-noise ratio in the NIR (i.e., above 6500 cm−1) was sometimes low and the bands were not always well resolved (see again figure 12A). However, in all spectra of samples from suites ENSMP 69866 and ENSMP 69880, the bands due to type I water were of equal or greater intensity than those due to type II water. This characteristic was also observed for emeralds with low alkali element concentration, such as those from Colombia (Saeseaw et al., 2014; Karampelas et al., 2019). From 2200 to 2850 cm−1, some weak bands linked to H2O, D2O, CO2, and chlorine were observed (de Donato et al., 2004; Rondeau et al., 2008). Notably, beryl’s FTIR spectra also presented strong crystallographic orientation phenomena: The relative intensity of these bands varied when spectra were acquired under different crystallographic orientations. No bands linked to clarity enhancement of emerald, which are commonly observed at around 3000 cm–1 (Johnson et al., 1999; Kiefert et al., 1999), were identified in any of these samples.
In figure 12A, a typical spectrum of a sample from the ENSMP 69881 suite is also presented in red. It is similar to the FTIR spectrum produced by other artificial glasses (Stephan, 2020; Cooper et al., 2020). Below 3200 cm–1, large bands due to combination modes and overtones of silicate glasses are observed. The bands at around 3500 cm–1 are possibly due to symmetric stretching of water molecules and/or stretching vibrations of the Si-OH group. The weaker bands at around 4500 cm–1 are due to combination Si-OH modes (Efimov and Pogareva, 2006).
Summary of Results. Of the 45 samples, 41 were confirmed to be emerald (suites ENSMP 69866 and 69880). As these stones are of gem quality and were set in the crown of Napoleon III in 1855, we can exclude any “young” emerald provenances, such as mines in Zambia and Zimbabwe, or even historic deposits with emeralds of lesser gem quality, such as those in Egypt and Austria (Giuliani et al., 2000, 2019). From the sixteenth century until the early twentieth century, the vast majority of gem-quality emeralds originated from Colombia (Keller, 1981; Bosshart, 1991a, Giuliani et al., 2000; Schmetzer et al., 2020).
The existence of the specific inclusion scene (e.g., three-phase inclusions with jagged outlines and gota de aceite), the fact that the NIR band related to type I water in beryl is of equal or greater intensity than the band related to type II water (signifying the presence of relatively low concentrations of alkali metals), and the absence of iron-related absorption bands in the Vis-NIR spectra all suggest that the samples came from Colombian mines. None of the samples presented microscopic or spectroscopic evidence of clarity enhancement. Emeralds with similar characteristics are found in other jewels from the same period (Keller, 1981; Karampelas and Wörle, 2022).
The microscopic and spectroscopic data of the four samples from suite ENSMP 69881 were found to be consistent with artificial glass. This was first accounted for in the museum’s internal gem identification report by one of the authors (FM), who made the determination using classic gemological tools in the 2010s. Their relatively high refractive index and specific gravity values point toward artificial glass containing lead. The spectroscopic characteristics of the artificial glasses from Napoleon III’s crown do not present any evidence of a recently fabricated glass. It is therefore possible that these imitations were part of the 1887 donation and not substituted at a later stage at the museum. Still, the cut and shape differ significantly from the identified emeralds, suggesting they were not set at the same time as the original crown’s creation in 1855. Instead, they could have been replacements shortly thereafter, when the eight large main diamonds were removed for use in other jewels created for Empress Eugénie (Morel, 1988).
Additional nondestructive measurements of the trace elements with a well-calibrated energy-dispersive X-ray fluorescence (EDXRF) spectrometer might help to further study the fabrication of the green glasses and also support the Colombian origin of the emeralds. Moreover, the use of a Raman spectrometer with more than one laser excitation wavelength and better spectral resolution, combined with the use of spectrometers covering the UV region down to 250 nm and the NIR up to 1500 nm, would provide further assistance in identifying the fabrication of the green glasses and further confirming the emeralds’ Colombian origin.
CONCLUSIONS AND PERSPECTIVES
In all, 41 out of 45 samples from ENSMP 69866 and ENSMP 69880 showed natural inclusions along with standard gemological observations characteristic of emerald. The Vis-NIR spectra presented absorption bands characteristic of Cr3+ and V3+, while iron-related bands were not observed in any of the spectra. In the NIR region, as analyzed by FTIR spectroscopy, the bands due to type I water were of equal or greater intensity than those due to type II water. A combination of spectroscopic and classic gemological methods points to Colombia as the most likely source of these 41 natural emeralds, given the crown’s age.
The four samples from suite ENSMP 69881 presented different characteristics. Classic gemological testing methods identified them as artificial glasses containing lead. Their Vis-NIR spectra revealed Fe2+ and/or Cu2+ as well as Fe3+ (or Fe3+-S2−) as the main causes of their coloration. We uncovered no evidence of the glass having been recently fabricated. Consequently, it is possible that these four artificial glass stones were set in the crown prior to their donation to the École des Mines. Morel (1988, p. 338) reports that the eight large diamonds were removed from the crown not long after its creation and replaced by “strass” (glass imitations, possibly containing lead). The substitution of these green glass stones for the original emeralds could have occurred at the same time.
As part of an ongoing collaboration between the LFG and the Mineralogy Museum of the École des Mines, the authors will continue investigating other gems that once belonged to the French crown jewels. It is only logical that in addition to exhibiting these gems, the Museum seeks to understand the science behind them, as educational and outreach tools. As this set of gems is considered a priceless national treasure, such studies can only be conducted within the Museum, using classical nondestructive gemological tools and mobile spectrometers. In the last two decades, several instruments useful for characterizing gems in situ have been developed in mobile versions, drawing the interest of researchers from various disciplines (Reiche et al., 2004; Petrová et al., 2012; Barone et al., 2016; Panczer et al., 2021; Karampelas and Wörle, 2022).
Only a few gemstones that once belonged to crown jewels or regalia have been scientifically examined—some still belong to royalty (Spain and the United Kingdom, for example), while others have been studied for their historical or artistic merit but not their gemological value. However, there has been a stronger desire over the last few decades to overcome these biases, and some museums are putting national treasures under their microscopes and spectrometers, publishing and sharing their results. We can acknowledge George Bosshart for conducting one of the first gemological studies of the Dresden Green, a 41 ct diamond from one of the oldest museums in the world, the Green Vaults (1723) in Dresden, Germany (Bosshart, 1989). As the French crown jewels were dispersed in 1887, a few pieces eventually landed in museums equipped with instruments and researchers willing to study great and historical gem treasures, such as the Hope diamond and the Napoleon diamond necklace at the Smithsonian Institution (Gaillou and Post, 2007; Gaillou et al., 2010, 2012, 2022; Post and Farges, 2014) and the Grand Sapphire of Louis XIV at the National Museum of Natural History in Paris (Farges et al., 2015). These gemstones are all remarkable not only for their history and consummate lapidary and jewelry skills, but also for the overall quality of the stones themselves and our understanding of their geologic and geographic origin. We can only hope that more museums will allow in situ nondestructive studies of their gemstones, whether set in jewels or not, in order to tell the full story and offer these treasures the appreciation they deserve.


