Greenish Blue Glass Imitating Gem Silica
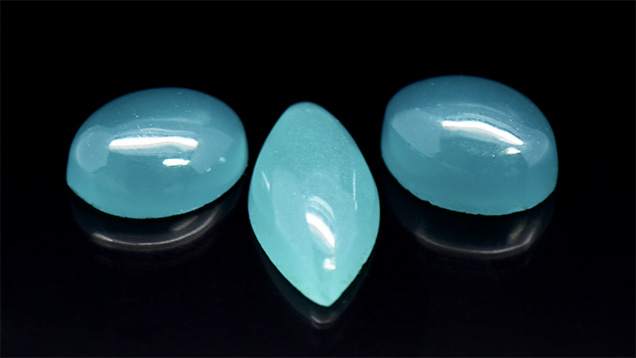
Gem silica, also known as “chrysocolla chalcedony,” is considered the most valuable variety of chalcedony. Its attractive blue to bluish green color is generated by finely disseminated minute inclusions of chrysocolla. The main sources include Taiwan, the United States, Mexico, Peru, and Indonesia. For years, gem silica has been especially popular in Taiwan. Due to the pleasing saturated blue color of Taiwanese material, which is among the world’s finest, it commands a premium price. At the same time, the current lack of production in Taiwan is driving prices substantially higher. Thus, imitations and treatments are gradually emerging in the marketplace, confusing customers. Recently we obtained three polished specimens from a gift shop in Taidong County, Taiwan (near the locality of the gem silica mine), that appeared to have good quality of color and transparency (figure 1). The merchant claimed they were gem silica mined in Taiwan, but they were subsequently identified as glass imitations.
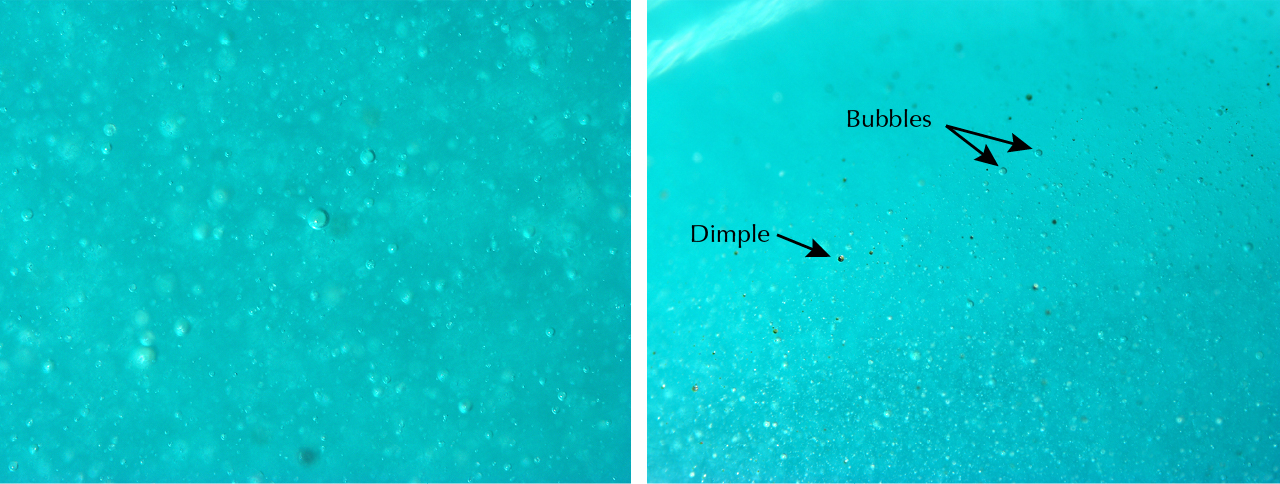
Standard gemological tests showed the following properties of the three samples: color—uniform greenish blue; diaphaneity—translucent; spot RI—1.48; SG—2.48 to approximately 2.57; fluorescence—inert to long-wave UV radiation, weak greenish white to short-wave UV radiation. Actual gem silica, meanwhile, has the following properties: color—commonly uneven; spot RI—1.54; SG—approximately 2.63. Examination with a gemological microscope revealed numerous obvious gas bubbles of different sizes (figure 2, left). In the case of the marquise sample, numerous gas bubbles led to a relatively low specific gravity. When viewed with oblique incident light, many small dimples were visible on the polished surface (figure 2, right). In addition, there were some small conchoidal fractures along the bottom edges of samples. In order to gain a more thorough understanding, further advanced analysis was carried out.


FTIR reflectance spectroscopy showed a main reflected band at approximately 1065 cm–1 (figure 3), consistent with the characteristic spectrum of glass (see Fall 2019 GNI, p. 443–445; T.B. Wang et al., “Relationship between the frequency of the main LO mode of silica glass and angle of incidence,” Journal of Chemical Physics, Vol. 119, No. 1, 2003, pp. 505–508). Chemical analysis by LA-ICP-MS detected multiple elements: Si (averaging 617000 ppmw), Na (averaging 151000 ppmw), Al (averaging 101000 ppmw), Ca (averaging 24900 ppmw), K (averaging 19600 ppmw), Ba (averaging 17800 ppmw), Pb (averaging 3840 ppmw), Mg (averaging 2580 ppmw), Fe (averaging 1620 ppmw), Cu (averaging 5940 ppmw), and Cr (averaging 716 ppmw). This composition identified the three samples as silicate glass, which is decidedly different from gem silica (whose majority component is silica and chrysocolla, a copper silicate). UV-Vis-NIR spectra of the specimens presented a strong broad absorption band around 760 nm (figure 4), revealing Cu2+ as the coloring agent. In addition, two weak absorption bands at 424 and 439 nm might have been related to trace amounts of Fe3+, while the 690 nm band was possibly due to the existence of Cr3+ (see W. Thiemsorn et al., “Redox ratio and optical absorption of polyvalent ions in industrial glasses,” Bulletin of Materials Science, Vol. 30, 2007, pp. 487–495; V. Vercamer, “Spectroscopic and structural properties of iron in silicate glasses,” PhD thesis, Université Pierre et Marie Curie-Paris VI, 2016, pp. 97–145).
Combining all the evidence, the three greenish blue samples were confirmed to be artificial glass colored by an unknown copper additive. Gas bubble inclusions were the diagnostic feature for identification, and FTIR spectra were also helpful. This case is a reminder that customers need to be cautious when purchasing gemstones, even near the geographic source.


