A Pearl Identification Challenge
ABSTRACT
Nacreous pearls are usually found in saltwater (SW) or freshwater (FW) environments, yet there are some reports of pearls originating from a brackish environment. Likewise, nacreous pearls may form naturally or by human manipulation (bead and non-bead cultured), but in some cases the origin is hard to prove and professional opinions are not always unanimous. Two pearls were examined by the authors, who were in the unique situation of being unable to positively identify either their origin (natural or cultured) or growth environment (FW versus SW). This in turn had a direct impact on the ability to determine which mollusk produced the pearls, a factor that would have helped answer the former two questions. It is very rare to find pearls for which all three of these criteria are in doubt, as usually it is straightforward to determine at least two of them. The results of this study illustrate the challenges that laboratories sometimes face when testing pearls.
INTRODUCTION
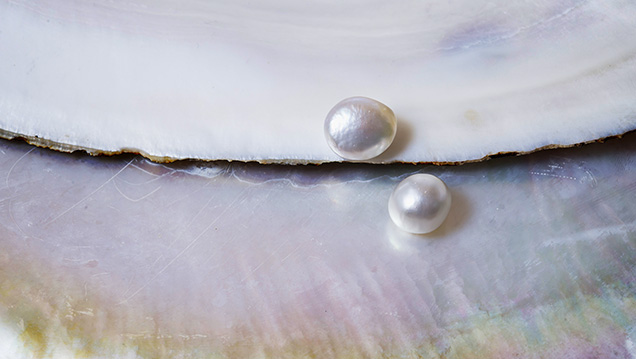
When a gemological laboratory receives pearls for examination, a series of tests are carried out to reach a conclusion on their identification (natural, cultured, imitation, or assembled); whether they formed in a saltwater (SW) or freshwater (FW) environment; and whether any treatments have been applied (color modification, filling, or coating). Some laboratories, such as GIA, also provide an opinion, whenever possible, on the mollusk that produced the pearls. The two pearls described in this work (figure 1) were submitted to GIA’s Bangkok laboratory at different times by different clients. They were subsequently purchased for further analysis after their identity (natural/cultured), their growth environment (FW/SW), and consequently the mollusk in which they formed proved challenging to determine. Trace element chemistry is an important factor to consider when identifying the environment in which a pearl-producing mollusk lived (Wehrmeister et al., 2007; Karampelas et al., 2019). A clear answer to this question, in turn, yields potential information about the cultured versus natural origin of pearls produced and may assist with mollusk identification (Hänni, 2012).
The initial results from the work carried out by GIA revealed internal structures that were not typical of either natural pearls or non-bead cultured pearls. Bead cultured pearls were quickly ruled out, as were assembled and imitation pearls. The most unusual initial findings related to the pearls’ chemistry and their optical X-ray fluorescence reactions. In fact, the questions that arose from the initial work carried out on the pearls led to discussions with other colleagues in the industry, and additional complementary tests at the Max Planck Institute for Chemistry and Johannes Gutenberg University, both located in Mainz, Germany, were carried out in order to compare the results with those obtained by GIA. The GIA authors felt that taking this approach would yield helpful data and discussions, which indeed turned out to be the case.
MATERIALS AND METHODS
Two pearls weighing 8.52 ct (sample A) and 10.66 ct (sample B) and measuring 11.81 × 10.45 × 9.21 mm and 13.77 × 11.82 × 8.67 mm, respectively, were examined with a variety of gemological, structural, and chemical analyses. Analysis of the pearls’ surfaces was carried out with gemological microscopes (magnification range between 10× and 60×) and documented by photomicrographs using a Nikon SMZ18 microscope (various magnifications up to 176×) incorporating Nikon NIS-Elements photomicrography software and a Canon PowerShot G16 camera. The pearls’ ultraviolet fluorescence reactions were observed under an 8-watt UV lamp with both long-wave and short-wave UV at 365 and 254 nm excitation wavelengths, respectively. A DiamondView unit provided deep-ultraviolet (<230 nm) luminescence reactions.
As X-ray film imaging has become largely obsolete, the two main X-ray techniques used to identify pearls today are real-time microradiography (RTX) (Karampelas et al., 2017) and X-ray computed microtomography (μ-CT) (Karampelas et al., 2010; Krzemnicki et al., 2010; Otter et al., 2014a). The former allows the tester to obtain results on the whole volume of the sample, while the latter reveals a pearl’s structure from micron-thin slices while reconstructing a three-dimensional model of the sample. While the vast majority of pearls submitted undergo only RTX investigation, as this technique is significantly faster and more cost-efficient, some require more in-depth μ-CT analysis. This technique allows the nondestructive investigation of finer structural details with high spatial resolution in three dimensions. Its higher sensitivity permits structural differences to be discerned down to the order of a few microns per voxel (or 3D pixel), depending on the overall size of the sample volume (e.g., Wehrmeister et al., 2008; Karampelas et al., 2010; Otter et al., 2014a).
In Bangkok the internal structures were examined using a Faxitron CS-100 2D real-time RTX unit (90 kV and 100 μA excitation) and a Procon CT-Mini μ-CT unit fitted with a Thermo Fisher 8W/90 kV X-ray tube and a Hamamatsu flat-panel sensor detector. Additional X-ray computed microtomography scans were obtained using a Scanco μ-CT 40 unit with an acceleration voltage of 70 kV together with a 114 μA target current at the University Medical Center of Johannes Gutenberg University in Mainz, Germany. The resulting images were processed using OsiriX, an open-source visualization software.
A custom-modified FocalSpot Verifier FSX-PF100 optical X-ray fluorescence unit (100 kV voltage and 3.2 mA current) incorporating a Canon EOS Rebel T4i camera was subsequently used in Bangkok to check whether the pearls originated from a marine or freshwater environment, as pearls from each react differently when exposed to X-rays (Hänni et al., 2005; Kessrapong et al., 2017). The results of energy-dispersive X-ray fluorescence (EDXRF) analysis provided further data to be used in conjunction with the optical fluorescence results.
The pearls’ chemical composition was initially analyzed in Bangkok using a Thermo Scientific ARL Quant’X EDXRF spectrometer. Since the results were inconsistent with those expected during routine pearl analysis, more thorough investigations were obtained by means of laser ablation–inductively coupled plasma–mass spectrometry (LA-ICP-MS) carried out in different laboratories. First, spot analyses were performed using a Thermo X Series II ICP-MS system in combination with a New Wave Research UP-213 laser ablation system at GIA laboratories in Bangkok and New York. U.S. Geological Survey (USGS) microanalytical carbonate reference materials MACS-1 and MACS-3 were used as matrix-matched calibration standards. A pulse repetition rate of 7 Hz, energy density of 10 J/cm2, and spot diameter of 40 μm were applied. The pearls were further investigated in Germany, with depth profiles obtained using a Thermo Fisher Element 2 single-collector sector-field ICP-MS paired with the same laser ablation system as before. A pulse repetition rate of 10 Hz, energy density of 8 J/cm2, and spot diameter of 80 μm were applied. Here, pearls A and B were analyzed with 33 and 36 spots, respectively, distributed in groups of three over their entire surface. Probing the pearls in groups of three adjacent spots permitted the technician to monitor the reproducibility of the trace element pattern in every location. Data reduction and elimination of obvious outliers were performed following a programmed routine in Microsoft Excel described in Jochum et al. (2007). The calibration followed the method for accurate trace element analysis of biogenic calcium carbonates published in Jochum et al. (2012), where refractory lithophile elements are calibrated with NIST glasses (SRM 610 and 612), while chalcophile and siderophile elements with low boiling points were calibrated using matrix-matched calibrated standards USGS MACS-1 and -3. A Leica DMRX incident-light microscope with well-defined zoom steps for each grid on its focusing adjustment screw was used to measure the depth of the ablation spots left in the pearls after analysis.
RESULTS
External Appearance. In most cases, gemologists and experienced members of the trade are able to visually identify pearls based on their external characteristics (luster, color, shape, etc.). However, these two pearls did not exhibit typical SW or FW features, and as a result their external appearance did not fit particularly well with either natural or cultured pearls. Based on the authors’ experience handling countless pearls of all types, the form of the platy overlapping nacreous structures (i.e., platelet size, spacing, and shape/appearance of the platelet edges—see figure 2) could be considered more indicative of FW than SW. The flat surfaces on one side of each pearl could also have been taken as an indicator of freshwater origin. The pearls did not display enough characteristic features to sway the decision one way or the other, however.

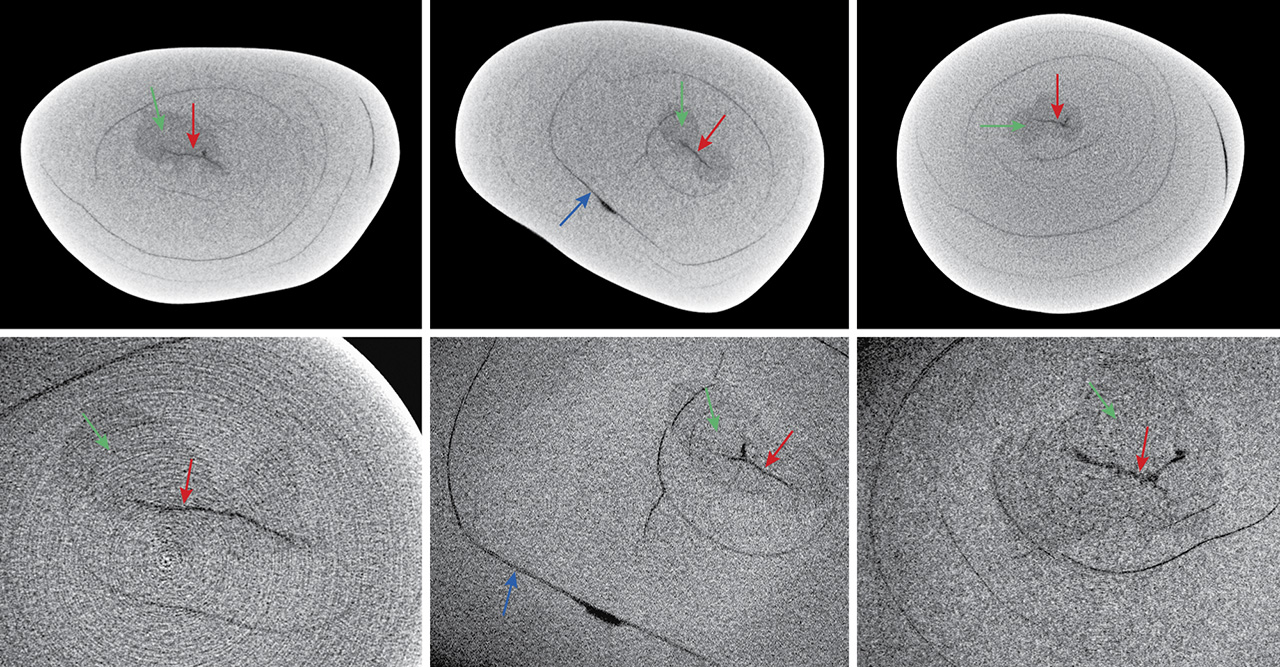
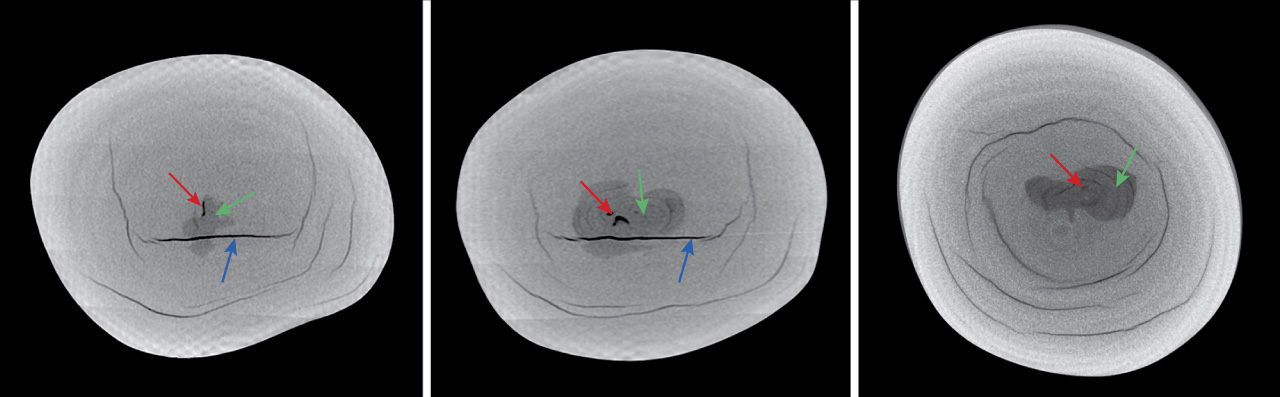
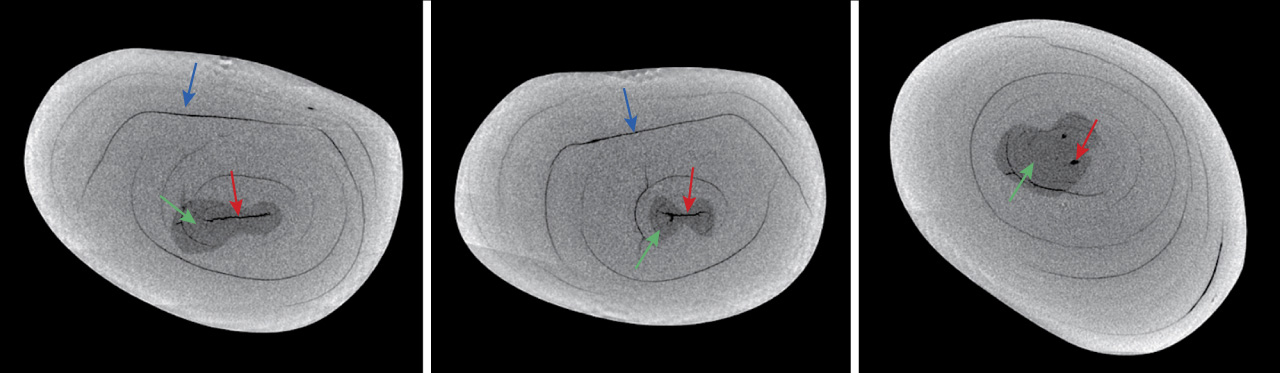
RTX and μ-CT Analysis. Both pearls in this study showed structures that were ambiguous when examined with the RTX units in Bangkok. Similarities in the darker organic-rich arcs extending from near the center to the outer surfaces and in small organic-rich areas adjacent to the centers were revealed. A straight organic-rich feature (figures 3 and 4), related to the flat surfaces visible on the exterior, was also observed in each pearl. Such structures are not conclusive of any particular type of pearl and do not match the SW or FW structures usually associated with non-bead cultured pearls (see box A), so natural origin remained a possibility. In order to identify the true origin, more work was considered necessary, so both pearls were further examined by μ-CT. The resulting μ-CT work provided more detail but did not resolve the origin to the complete satisfaction of those who examined the data. As can be seen from the sample μ-CT images in figures 3–6, the structures were inconclusive, although the majority of opinions favored a cultured origin based on previous testing experience. However, an idea of their chemistry was also needed before reaching any conclusions, as linking the internal structures to a known formation environment is an important part of pearl identification.

Box A: Typical Saltwater and Freshwater NBC Pearl Microradiographic Structures |
|
A selection of NBC pearls showing structures representative of those encountered in saltwater (left) and freshwater (right) varieties. The saltwater pearls tend to show pronounced void and/or organic-rich structures or more linear features that are often elongated rather than short, but examples of the latter are also observed and can be more challenging to distinguish as proof of cultured formation. On the other hand, freshwater pearls tend to show distinct twisted linear structures or voids, quite often with distinct associated growth rings around them, and sometimes boundary-like features as indicated by the red arrows on a couple of the microradiographs. Unlike saltwater pearls, the linear/void structures observed in freshwater pearls are sometimes hard to resolve and require examination in several directions. Additional work using X-ray computed microtomography (μ-CT) is not unusual when it comes to those examples that do not readily reveal their identity. It is also possible to understand how suitably positioned/sized drill holes within some samples may complicate the identification work and lead to differing opinions between gemologists and laboratories. 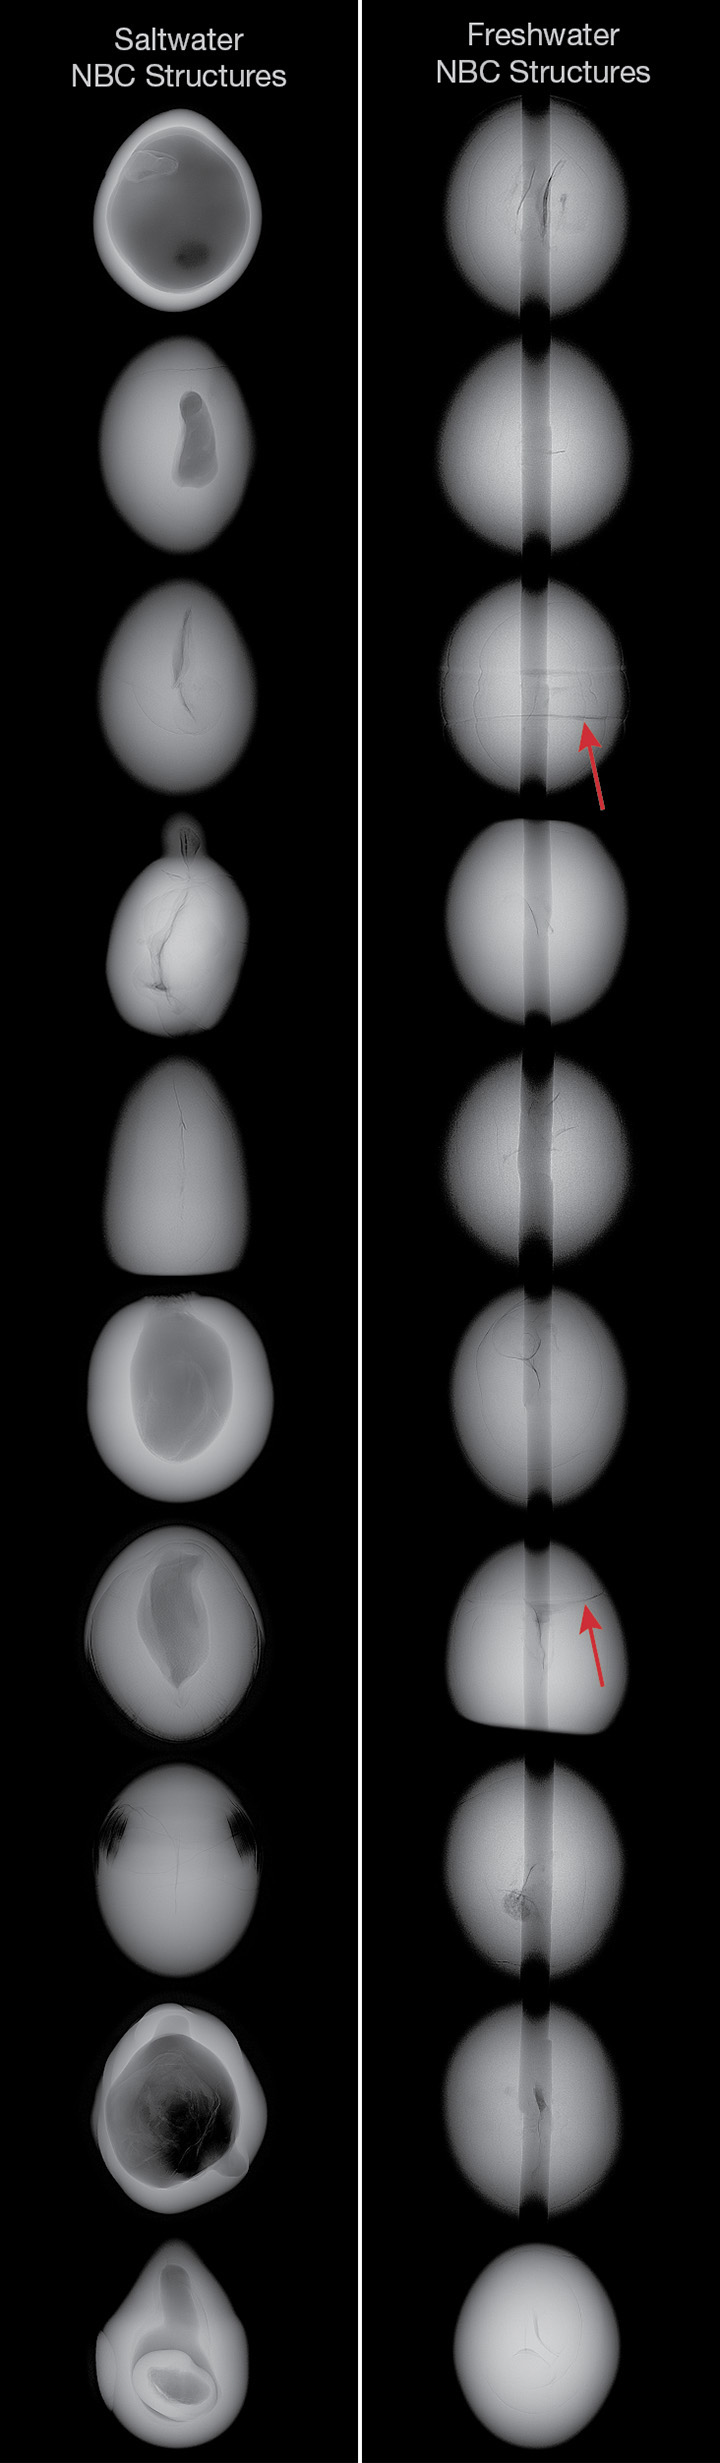
Figure A-1. RTX images of known undrilled saltwater (left) and drilled freshwater (right) NBC pearls showing the differences in their internal structures.
|
Complementary μ-CT and trace element characterization were performed at Mainz University and the Max Planck Institute for Chemistry, respectively. The additional findings matched those of GIA’s, as can be seen in figures 5 and 6. However, GIA’s analysis time was 16 minutes, compared with 5.4 hours at Mainz University, which prompted another analytical run in which the pearls were positioned closer to the tube to increase magnification. The acquisition time difference is due to the equipment used and the software/parameters applied, which is why a second opinion was sought, since the lengthier analysis usually yields sharper features. Following the μ-CT results, the trace element results were considered even more important for the identification of these particular pearls.
EDXRF. Since the interpretation of the RTX and μ-CT data failed to reach a conclusive identity, other tests had to be considered in order to help establish either a natural or cultured origin. One of the main supporting techniques available to gemologists is trace element analysis. By confirming whether a pearl is SW or FW and linking the environment to the RTX and/or μ-CT structure, the decision on a pearl’s identity can often be made easier.
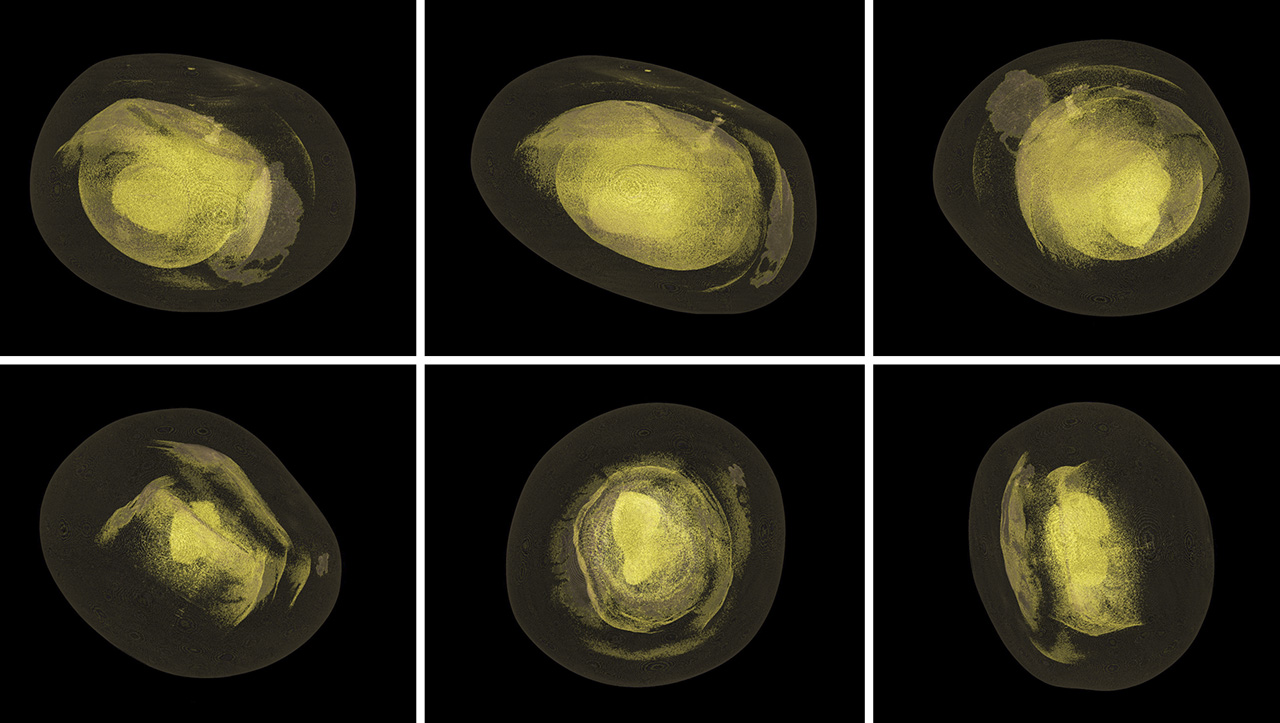
In Germany, OsiriX 5.8.5 data visualization and analysis software was used to further investigate the pearls using orthoslices and 3D volume rendering (figure 7). The results indicated that the composition of the layers varied significantly in density, with four internal layers showing an unenclosed profile—visible as yellow structures in the figure—different from the main body of the pearl. The introduction of such software in pearl identification has been used to provide more detail in cases worthy of additional study (Otter et al., 2014a; Zhou et al., 2016). The yellow areas in question did not appear to reach the surface, so it is unlikely that they are related to the trace element characteristics, although the only way to verify this would require cutting the pearls in half and analyzing their trace element chemistry in more detail.
In order to determine their formation environment, the pearls were each tested in an EDXRF spectrometer. While lower manganese (Mn) levels (below detection limits of around 20 parts per million) usually indicate a SW origin, higher values (most often from 150 ppm into the low- to mid-thousands) identify a FW origin (Wada et al., 1988; Wehrmeister et al., 2007). Some of the gemologists who examined the pearls favored a FW origin based on the internal structures observed via the X-ray work. Therefore, further EDXRF analysis was carried out in more positions on the pearls to provide additional data (table 1). This produced very interesting and conflicting results that GIA had not encountered previously, which led to further research on these pearls. Based on the EDXRF results, the decision was made to check the pearls’ reactions under optical X-ray fluorescence conditions. Pearls that fluoresce strongly when tested by this method tend to originate in FW environments, as the Mn content is higher and is thought to cause the strong visible reaction; in SW pearls, Mn is low or absent, and hence no reaction is observed (Hänni et al., 2005; Kessrapong et al., 2017). Strontium (Sr), on the other hand, is known to reach high concentrations for biogenic calcium carbonates (i.e., pearls and shells from SW environments), while low Sr values are characteristic of FW origin (Wehrmeister et al., 2007). Mn and Sr concentrations, combined with those of other elements, are useful tools to determine the habitat of the pearl-forming mollusk (saltwater or freshwater).

According to the results from EDXRF analysis, pearl A should in theory be of saltwater origin, as the consistent results from the six different positions tested did not find detectable amounts of Mn. On the other hand, pearl B seemed to be a mixture of saltwater and freshwater origin, which came as rather a surprise. This is the first time GIA has encountered such mixed trace element signatures in a pearl, and to our knowledge there are no other recorded cases of such testing results in the literature.
Optical X-Ray Fluorescence. To further examine the pearls and see how the data from the EDXRF results would be reflected in the visual reactions of the elemental distributions throughout the pearls, we turned to the simple but effective method of optical X-ray fluorescence. A pearl with mixed trace element signatures should in theory show a mixed reaction corresponding to the areas of freshwater and saltwater composition detected. The saltwater pearl, based on known saltwater pearl reactions, should show no reaction or at best a very weak reaction. Pearls that exhibit moderate to strong greenish fluorescence usually contain sufficient Mn to generate the effect, while those that show very weak fluorescence or are inert lack sufficient levels of Mn and are usually associated with saltwater environments (Hänni et al., 2005). The results obtained for pearls A and B are shown in figure 8.
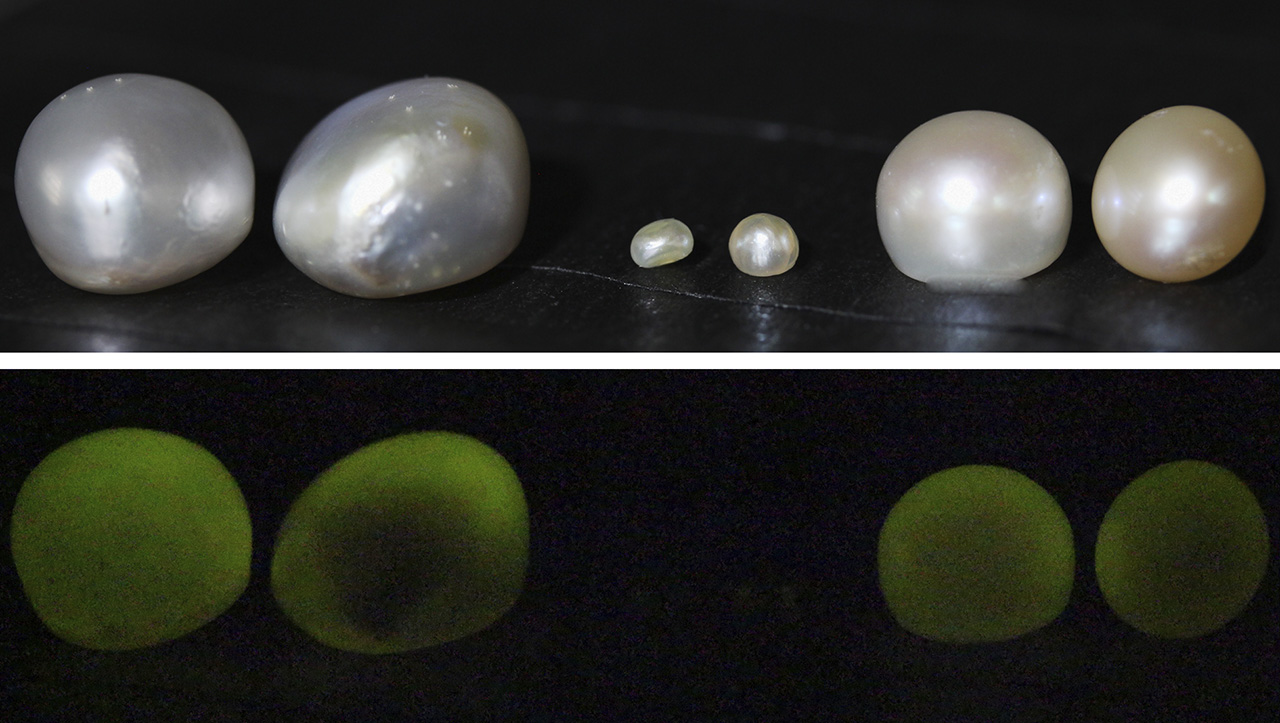
The reactions were completely at odds with the testing results already described. Instead of a heterogeneous reaction, pearl B exhibited a fairly homogenous moderate to strong greenish yellow reaction, while the apparent SW pearl (A) revealed a very similar reaction to the known FW samples, which was very surprising given the trace element data. This added to the identification challenges: Not only was the nature of their origin (natural or cultured) in doubt, but so was the environment in which they formed. On top of this, the question about Mn and its role in fluorescence immediately came into focus. This relationship is not yet fully understood, so it was decided that even further analysis was needed for these two examples.
LA-ICP-MS Analyses. Since the EDXRF results and subsequent optical X-ray fluorescence analysis produced unusual results, we turned to LA-ICP-MS to obtain more accurate trace element data for comparison. In routine pearl testing, LA-ICP-MS analysis is not usually applied since the EDXRF and optical X-ray fluorescence techniques provide sufficiently accurate and distinct data to reach a conclusion on the exact environmental origin. When combined with the pearls’ external appearance, the form of their platy structure, and their internal structures, the identification of the environment becomes even more accurate. For the two pearls under discussion, their external appearances, platelet form, internal structure, chemistry results, and optical X-ray fluorescence reactions were all inconsistent with regard to any particular type of pearl, environment, or mollusk.
The initial ICP work was carried out in Bangkok after the pearls were acquired. We chose two preliminary spots for pearl A and six spots for pearl B, and the results are shown at the top of table 2. Surprisingly, the results from the Bangkok unit on pearl A still fell within those expected from SW pearls, so it was decided to hold the pearl until the results of pearl B were known.

Since the results from two spots on pearl B agreed with two of the areas tested by the EDXRF spectrometer, the decision was made to send the pearl to GIA’s laboratory in New York for examination using their LA-ICP-MS unit to check for consistency. The results proved very similar and are shown in table 2 for comparison.
As the chemistry of the pearls and their fluorescence reactions were so intriguing, we also sent them to one of the co-authors (LMO) for more detailed chemical analysis in Mainz. In order to obtain a good set of results with which to perform their calculations, that team tested in total 33 spots (measured as 11 groups of 3 adjacent spots) on pearl A and a total of 36 spots (measured as 12 groups of 3 adjacent spots) on pearl B. The estimated depth of these ablation spots was around 270 μm. The results of the analysis were consistent with GIA’s findings for both pearls (see table 2). While the positions of the spots analyzed by GIA in New York and Bangkok were in similar positions, those analyzed by researchers in Mainz differed slightly owing to the greater number of spots examined.
The greater number of spots evaluated as depth profiles over a greater surface area revealed deeper Mn-rich areas (figure 9, A and B). Pearl B showed a higher concentration of Mn closer to the surface in several spots (figure 9, C and D). Both pearls showed a pattern of low Mn values of around 20 ppm, characteristic for SW conditions, rising steadily to high values of over 1000 ppm, which are characteristic for FW conditions. These high Mn values are found generally closer to the surface in pearl B, on average at about 100 μm depth, whereby the depth of the Mn-rich areas was found to be very heterogeneously distributed over the surface of the pearl, ranging from its presence directly at the surface to its absence within the profile. Pearl A showed the Mn-rich area at around 240 μm depths on average. In addition, bivariate double-logarithmic plots showing the full datasets of both pearls for Mn versus Mg (figure 9E) as well as Mn versus Sr (figure 9F) reveal further mixed FW-like (high Mn and low Mg/Sr) and SW-like (low Mn and high Mg/Sr) compositions. The heterogeneity observed in Mg and Sr shows that the concentration of these elements changes similarly within the depth profiles. Thus, it is clear to see that while both pearls appear to contain areas of both saltwater and freshwater trace element characteristics, pearl A trends generally more toward saltwater than pearl B, even if neither pearl’s chemistry is specific to a defined environment.

UV Radiation and DiamondView Reactions. The majority of white to cream-colored nacreous pearls exhibit a weak to strong, chalky yellow to bluish fluorescence (depending in part on the mollusk species) under short-wave and long-wave UV radiation. These reactions may be further influenced by various processes, including treatments (Strack, 2006). Such treatments may also provide some indications about the nature of the pearls. For example, bleaching is commonly applied to cultured freshwater and akoya pearls and may show as a stronger bluish reaction in some examples. Both samples studied fluoresced a weak chalky yellow under short-wave UV, while pearl A reacted with a moderate chalky yellow fluorescence under long-wave UV and pearl B showed a similar reaction but with more of a blue component. The reactions were not those typically associated with cultured FW pearls or akoya pearls that have undergone bleaching. The DiamondView unit, although not always useful in distinguishing natural from cultured or saltwater from freshwater pearls, may aid in determining treatments. However, since these were white pearls that usually show a marked blue reaction within the DiamondView, we did not expect to see anything unusual, and that turned out to be the case when both pearls exhibited a characteristic blue reaction (figure 10).

DISCUSSION
The results obtained from the analysis described so far led to two main questions: First, did the pearls form naturally in a mollusk without any human intervention? Second, did the mollusks live in a SW or FW environment? Most of the time these questions are relatively straightforward to answer, but in this case we were still uncertain after examining these two pearls.
The first method of identification employed was RTX analysis. The results showed suspicious structures, although not enough to prove they were non-bead cultured. It was still possible that the pearls were natural, and many pearls examined by GIA over its history have shown odd natural structures. The results led to the next identification method, μ-CT analysis. Again the results revealed structures that could be considered either natural or non-bead cultured and were not definitive.
The chemistry was considered next, and in this case the exact formation environment (saltwater or freshwater) could not be determined. EDXRF data raised more questions. Pearl A yielded <5 ppm Mn in every spot and an average concentration of 1500 ppm for Sr. Both trace elements are considered environmental indicators, since a combination of <20 ppm Mn and >1300 ppm Sr is associated with marine environments, while the reverse relation of >20 ppm Mn and <1300 ppm are indicative of freshwater origins (Wehrmeister et al., 2007). However, the EDXRF analysis employed covered a 6.0 mm area of the surface (dependent on the collimator applied) and the penetration depth was on the order of a few microns, so it could not determine the chemistry deeper within the samples.
LA-ICP-MS is better suited to determine the elements deeper within a sample, although still limited to micron depths, yet the surface area tested is significantly smaller (Lu et al., 2011). LA-ICP-MS results identified both FW and SW signatures in different average spot compositions. The LA-ICP-MS depth profiles, obtained at the Max Planck Institute for Chemistry in Germany, revealed a trace element composition not previously observed for pearls: Several environment-indicative elements (namely B, Mg, Mn, Sr, and Ba) were found to vary in concentration, forming discrete layers of alternating FW-like and SW-like composition. In all spots, the patterns start at low Mn values of around 20 ppm that likely correspond to SW conditions and rise steadily to high values of over 1000 ppm, indicative of FW growth environments, for both pearls (figures 9B and 9D). The FW conditions were found closer to the surface along the depth profile of pearl B at approximately 100 μm, compared to approximately 240 μm for pearl A. Peak concentrations decrease and rise in pearl B (figure 9D), creating a steady, alternating trend. These patterns imply that the pearls grew uninterruptedly within a single mollusk—and not in two separate mollusks—first within FW and later SW environments, which would have produced abrupt changes in their trace element characteristics. Such results would rule out the possibility that these pearls represent “atypical bead cultured pearls,” which usually show clear boundaries marking the growth zones of the host (outer layers) and the inserted material (Hänni et al., 2010). It is worth noting that saltwater mollusks are routinely used as hosts, whereas atypical freshwater hosts are a rarity (Scarratt et al., 2017). The LA-ICP-MS craters were only drilled to a depth of around 270 μm since greater depths at some point hinder the rising evaporate and also increase the chance of element fractionation. However, it can be expected that the concentrations of Mn, Sr, and Mg continue to alternate toward the center of the pearl.
The alternating patterns between FW-like and SW-like compositions could result from growth in a river delta where the predominant water input is freshwater, with only occasional season-dependent saltwater input when the river carries little water (e.g., during summers in warm climates). While the authors are unaware of farms that operate in brackish waters, reports do exist of shells originating from around islands within the Mississippi Delta in North America (Moore, 1961), and farms are known to operate in river deltas in Vietnam (L.T.T. Huong, pers. comm., 2016), both underscoring this possibility. However, this does not aid in determining the natural or cultured nature of the pearls from this study. Although this hypothetical setting favors an overall FW-related origin, it does not satisfyingly answer the question of the bivalve species that produced these pearls, since little is known about the environmental tolerances of the Unionidae and Pteriidae families.
These changes in trace element composition are, however, too low to affect the major-element composition of the pearls and therefore cannot discriminate between marine and freshwater nacre in the μ-CT datasets. Instead, the μ-CT datasets show the density changes between organic material and nacre. The not fully enclosed organic layers could represent “pseudoannuli” growth rings (Jacob et al., 2011), which are characteristic of continuous growth within a mollusk, whereas the use of beads as nuclei for further pearl growth would likely produce a prominent concentric layer of organic material, as often observed for bead cultured pearls (e.g., Karampelas et al., 2010; Krzemnicki et al., 2010; Otter et al., 2014b). These inner unenclosed growth rings also lead to questions about the intensity of the pearls’ optical X-ray fluorescence, since most saltwater layers that cover freshwater layers/components (i.e., freshwater nuclei in most bead cultured pearls) mask the effects, producing weak to moderate fluorescence. This was not the case with these two samples, and the fluorescence was quite marked (again, see figure 8).
Average nacre deposition rates for marine environments range from 0.5 mm/year for akoya cultured pearls produced by Pinctada imbricata fucata in temperate climates (e.g., eastern Australia) to 2.0 mm/year for cultured pearls produced by Pinctada maxima in tropical climates in the South Seas (e.g., Strack, 2006; Otter et al., 2017). Lower deposition rates of akoya pearls are likely an effect of the colder climate compared to the warmer, near-equatorial distribution of Pinctada maxima (Strack, 2006). Freshwater species such as Hyriopsis schlegelii and Hyriopsis cumingii or their hybrids are known to have higher growth rates and can deposit up to 10 mm of nacre within six years, or approximately 1.5 mm/year (Akamatsu et al., 2001). Using the mean diameter of 10.5 mm for pearl A, we can assume a growth period of seven years (FW growth rate) or between 5 and 21 years (for tropic and temperate marine growth rates, respectively), depending on the mollusk species and environment used (the numbers for pearl B are in the same range). The shorter FW growth period of seven years would therefore still be in the timeframe of FW NBC pearls from China (Akamatsu et al., 2001). On the other hand, slower growth rates from a marine environment would point toward a natural origin, as the estimated SW growth period is up to 10 times longer. Since species of the Pinctada genus can reach ages of up to 40 years (Strack, 2006), a growth period of around 20 years does not seem impossible.
CONCLUSION
The identification of these two pearls presented challenges on many fronts. While the authors believe that their internal structures are more likely NBC, this is by no means definite. Hence, there is a chance they could be natural pearls with unusual structures. Pearl testing is relatively straightforward in most cases, yet there are plenty of instances where identification is subjective and opinions may differ, even within the same organization, let alone separate ones. Likewise, determination of the environment in which pearls form is almost always straightforward. Yet the pearls in this report prove that on very rare occasions it is possible to encounter trace element anomalies, thus leading to questions about the true environmental origin of the samples. The distinct fluorescence observed under X-rays as well as the pearls’ general appearance led the authors to believe that they are more likely FW pearls, yet there is no clear explanation why either pearl (particularly A) should have reacted so markedly. Even if there are zones of freshwater material within the saltwater material, the freshwater reaction should in theory be masked to a greater extent, just as the reactions of freshwater bead nuclei in almost all commercial bead cultured pearls are when subjected to the same test.
As a consequence, these two factors also call into question the identity of the producing mollusk for laboratories, such as GIA, that routinely attempt to identify the species of mollusk in which a pearl formed. If either of the pearls could be identified as SW, they would likely have formed in a species from the Pteriidae family. If they were FW, however, they would have formed within a mussel species belonging to the Unionidae family, which inhabits rivers and lakes worldwide. The location would in many ways be influenced by whether they formed naturally or with human assistance, so again we come full circle to the subjectivity involved in evaluating all three factors from the data obtained during this study.
Although the final conclusions were not unanimous and questions still exist about the true identification, environment, and producing mollusk in which the pearls formed, the results obtained prove that there is always something new to discover when it comes to the analysis of gem materials, especially organic ones such as pearls. Further destructive work on the pearls, specifically cutting each in half to study their internal chemistry in greater detail and conducting deoxyribonucleic (DNA) analysis on powder samples extracted (Meyer et al., 2013; Saruwatari et al., 2018), might be necessary to reach a possible conclusion.


