Chart Gems & Gemology, Summer 2017, Vol. 53, No. 2

Chart: Inclusions in Natural, Synthetic, and Treated Sapphire


Sapphires from a variety of sources.
Figure 1. Sapphires from a variety of sources. Faceted stones (left to right): 6.36 ct pink/orange (padparadscha), 1.63 ct pink, 4.76 ct violet, 5.43 ct violet purple, 3.03 ct blue, 2.12 ct blue, 8.06 ct yellow, 3.46 ct yellow, 2.00 ct orange, and 1.01 ct deep orange. Crystals (left to right): 9.88 ct pink, 17.80 ct violet, 30.07 ct purple, 42.13 ct blue, 10.84 ct yellow, and 5.86 ct yellow-orange. From the GIA Eduard J. Gübelin Collection and Bill Larson, Pala International. Photo by Robert Weldon/GIA.

This is the second chart in G&G’s series focused on micro-features often observed in natural, treated, and synthetic gems. Sapphire (figure 1) was chosen because of its enduring importance within the gem trade. Demand for this gem species has been the driving force behind the development of treatment techniques to improve natural stones and the continued production of inexpensive synthetics. 

A negative crystal filled with carbonate and analcime minerals shows colorful thin-film interference in this untreated sapphire from Yogo Gulch, Montana. Field of view 1.28 mm.
This selection of photomicrographs reveals some of the typical and less common inclusions and other growth features seen in natural sapphires.

Natural sapphires, which originate in certain igneous or metamorphic geologic environments are commonly treated to improve their color or clarity. The most common processes involve heat treatment to improve color. Synthetic sapphires have been produced for more than a century, mostly by melt, flux, or hydrothermal solution methods (Hughes, 2017). All of these materials are widely encountered in the jewelry trade.

This platinum crystal inclusion in a synthetic sapphire shows a characteristic tapered morphology. This feature is diagnostic of flux growth, as in this Chatham synthetic sapphire. Field of view 1.72 mm.
Synthetic sapphires are grown by different methods, and they display different micro-features than those seen in natural sapphires.

The most essential instrument in separating natural stones from synthetics and treated specimens is the binocular microscope. The information gathered from a brief microscopic observation of an unknown gem is critical for accurate identification—and limited only by the gemologist’s own knowledge. No better references exist for understanding the microscopic features of corundum than the three-volume Photoatlas of Inclusions in Gemstones by Eduard J. Gübelin and John I. Koivula (1986, 2003, and 2005). Gemologists seeking to understand the many other aspects of gem sapphire, including physical properties and information on the many different localities, should consult Ruby & Sapphire: A Gemologist’s Guide, by Richard W. Hughes (2017). This is considered the premier reference on the subject.

Micro-features seen in sapphires that have been treated by heating, or by filling of open fractures, to improve their color and clarity.

The selection of photomicrographs chosen for this chart represents the wide variety of inclusion scenes one might encounter in sapphire. Examples of inclusions that may be highly indicative of a particular origin are provided, such as a tourmaline crystal in a sapphire from Kashmir, India. Other images highlight features that may be diagnostic for a particular treatment. A case in point is the “internal diffusion” seen in a heat-treated sapphire, induced as the titanium from rutile silk inclusions was dissolved into the crystal lattice of the host sapphire at high temperatures. This dissolved titanium pairs with iron to increase the amount of blue color in the stone. Synthetics are also represented on the chart, with images of sapphires grown by flux, flame fusion, hydrothermal, and other methods.

We hope the reader will enjoy this look into the micro-features of sapphire and find the images useful and interesting. For more information on sapphire and its inclusions, see our suggested reading list.
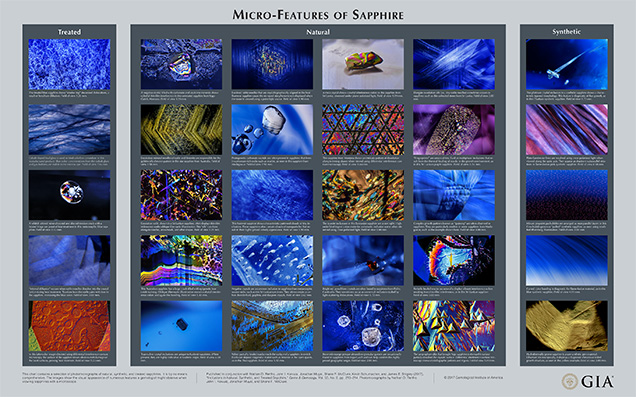
 

This chart contains a selection of photomicrographs of natural, synthetic, and treated sapphires. It is by no means comprehensive. The images show the visual appearance of numerous features a gemologist might observe when viewing sapphires with a microscope. Published in conjunction with Nathan D. Renfro, John I. Koivula, Jonathan Muyal, Shane F. McClure, Kevin Schumacher, and James E. Shigley (2017), “Inclusions in Natural, Synthetic, and Treated Sapphire,” <em>Gems & Gemology</em>, Vol. 53, No. 2, pp. 213–214. Photomicrographs by Nathan D. Renfro, John I. Koivula, Jonathan Muyal, and Shane F. McClure.
This chart contains a selection of photomicrographs of natural, synthetic, and treated sapphires. It is by no means comprehensive. The images show the visual appearance of numerous features a gemologist might observe when viewing sapphires with a microscope. Photomicrographs by Nathan D. Renfro, John I. Koivula, Jonathan Muyal, and Shane F. McClure.

Mr. Renfro is analytical manager of the gem identification department and microscopist of the inclusion research department, and Mr. Koivula is analytical microscopist, at GIA in Carlsbad, California. Mr. Muyal is a staff gemologist, Mr. McClure is global director of colored stone services, Mr. Schumacher is a digital resources specialist at the Richard T. Liddicoat Library and Information Center, and Dr. Shigley is distinguished research fellow at GIA in Carlsbad.

Hughes R.W., with W. Manorotkul and E.B. Hughes (2017) Ruby and Sapphire: A Gemologist’s Guide. RWH Publishing, Bangkok.