Mineralogy and Geochemistry of Turquoise from Tianhu East, Xinjiang, China

ABSTRACT
The Tianhu East turquoise deposit is located 180 km southeast of the city of Hami (also known as Kumul) in the Xinjiang Uyghur Autonomous Region of China. This deposit has been mined since as early as 1279–379 BCE. New mining activity took place around 2015, and some of the production emerged briefly on the Chinese market. Mining was subsequently prohibited because of the location’s protected status as an archaeological site. The geology of Tianhu East turquoise as well as updated reports and field exploration are systematically summarized in this study. The turquoise usually occurs as blue and bluish green veins in the fissures and shear zones of quartzite in the Cambrian Pochengshan Formation. It is characterized by high lithium, vanadium, chromium, strontium, and gallium concentrations and low barium content. Multiple associated minerals (e.g., quartz, apatite, goethite, hematite, jarosite, bonattite, muscovite, atacamite, svanbergite, and gypsum) were identified using Raman spectroscopy and electron probe microanalysis. This study contains the first report of atacamite in Chinese turquoise. Petrography, mineralogy, and geochemistry of the bedrock as well as the crystallization sequences of the associated minerals are highlighted. Based on the results, the authors propose a supergene weathering origin and elemental derivation for Tianhu East turquoise. Black shale was likely the main original source of the aluminum, phosphorus, and copper necessary for formation, while quartzite provided enough space for precipitation.
Tianhu East turquoise is found in the Xinjiang Uyghur Autonomous Region (hereafter referred to as Xinjiang) of northwestern China (figure 1), the geographic hinterland of Eurasia bordering Mongolia, Russia, Kazakhstan, Kyrgyzstan, Tajikistan, Afghanistan, Pakistan, and India. Xinjiang was once a vital part of the historic Silk Road trade route. The term “Tianhu” is a geographic descriptor, with the specific turquoise deposit located to the east of Tianhu, hence the name “Tianhu East.” The region boasts rich gem resources and is regarded as a significant source for high-quality nephrite (Y. Liu et al., 2011a,b, 2016; Gao et al., 2019).
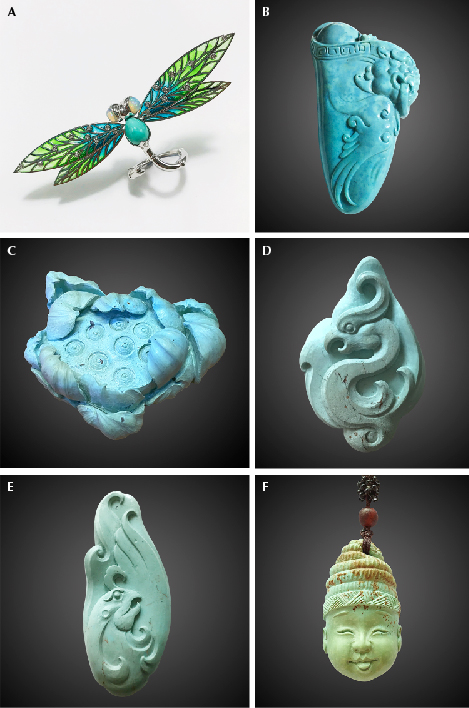
Turquoise is a treasured gemstone with a 9,000-year history in China, capturing the attention and imagination of not only the ancient Chinese but also modern geologists, gemologists, and archaeologists (Pang, 2014; Qin, 2020; Zhang, 2022). Two important ancient deposits, located at Tianhu East and Heishanling in Xinjiang, were mined between 3,300 and 2,400 years ago (Y.X. Li et al., 2019). From 2016 to 2021, Chinese archaeologists conducted excavations of these two sites, which revealed clear evidence of stone tools used for mining, as well as turquoise fragments and other relics (Y.X. Li et al., 2019, 2020). In the 2010s, Tianhu East turquoise briefly emerged on the Chinese jewelry market for a few years (figure 2).
Geologically, the parent rocks of Chinese turquoise are mainly magmatic or sedimentary. The deposits can be classified into two distinct types: igneous-related and black shale–related. The igneous-related deposits are distributed mainly in Ma’anshan and Tongling City, in Anhui Province of east-central China, where turquoise is usually discovered in the oxidized, fractured zones of altered igneous rocks (Wei and Guan, 2003; Zhou et al., 2013; Shen and Zhao, 2019; Shen, 2020b).
However, most turquoise deposits in China are related to black shale, and these are widely distributed in the Hubei, Shaanxi, Henan, and Qinghai provinces, as well as Xinjiang (Tu, 1996, 1997a; Huang, 2003; Zhou and Jiang, 2005) and the Inner Mongolia Autonomous Region (Cao et al., 2021). About 90% of this turquoise, especially the material with desirable color used for large, high-value ornaments and carvings in the Chinese jewelry market today, originates from black shale–related deposits. The mines in Zhushan County, China’s most commercially significant locality, are one example. While the hypotheses of turquoise genesis (hydrothermal, contact metasomatic, and supergene origin) were proposed by Pogue (1915), the genesis of black shale–related deposits remains unsolved. Because of the complex geologic settings and local geography, few recent investigations have been conducted on these deposits to clearly demonstrate the formation process. Generally, black shale zones are not only the original source of the elements necessary for formation but also where the precipitation of turquoise occurs.
Fortunately, the occurrence in Tianhu East offers a representative case to decipher the genesis of black shale–related deposits. Here the turquoise is hosted in quartzite, as the black shale source zones are located on quartzite precipitation zones. Thus, the distribution and relationship of black shale and quartzite in the Tianhu East deposit would help clarify the processes of leaching, migration, and deposition of the weathering solution, allowing us to determine the formation mechanism for black shale–related turquoise deposits.
Spectroscopic (Raman, infrared, and ultraviolet/visible), structural, and major/trace element characteristics of Tianhu East turquoise were reported by X.F. Liu et al. (2018). But detailed geological field reports were unpublished, and formation was not discussed. This study summarizes the earlier historical reports and presents the geology of this deposit based on the authors’ field exploration. Mineral assemblages in Tianhu East turquoise have not been previously studied, but they could provide useful information about the geologic formation process. Techniques such as Raman spectroscopy and electron probe microanalysis (EPMA) with energy-dispersive spectroscopy (EDS) were applied to investigate the associated minerals. The gemological, mineralogical, and geochemical features of Tianhu East turquoise are significant fingerprints pointing to its origin. This study also illuminates the essential petrographic and geochemical clues to its genetic origin and proposes a formation model for black shale–related turquoise.
LOCATION AND MINING
The Tianhu East deposit is located at 41°36′7″N and 94°36′3″E, 180 km southeast of the city of Hami in East Tianshan of Xinjiang, northwestern China (figure 1). This area is at an elevation of 1186–1444 m, lying in the denuded hills of the Gobi Desert in the Beishan Mountains. The region is characterized by extreme drought, and the bedrock is well exposed. In 2017, with the support of local miners, the authors conducted field exploration of the Tianhu East deposit. Turquoise had recently been mined on a small scale using open-pit mining, but no mining was being conducted during our fieldwork. Mining has been prohibited by the local government because of the site’s cultural heritage significance.
GEOLOGY
Regional Geology. The Tianhu East turquoise deposit is located on the southern edge of the multi-period composite continental margin magmatic arc of the Middle Tianshan Mountains west of the Nalati and Hongliuhe suture zone, adjacent to the Early Paleozoic rift of the North Beishan belt. There are multi-stage tectonic-magmatic activities in this area where intrusive rocks are found and the strata are extensively deformed (Chen and Xu, 2001). The tectonic structures are in the middle of the Jianshanzi uplift, which belongs to the Kuluktag-Xingxingxia continental collision zone of the Tarim plate, extending in a NEE direction between the Jianshanzi fault and the Hongliuhe deep fault (Yang et al., 2008). The geologic structure is based on the monoclinal structure of the ore deposit and metamorphic rock strata (strike NE60°–75°) between the regional east-west Jianshanzi fault and the Hongliuhe fault, which are chronically active and control the local stratigraphic distribution as well as the tectonic and magmatic activities. The stratigraphic structure is dominated by longitudinal faults that mainly extend NE and NEE and are accompanied by multiple sets of secondary faults, reflecting multi-stage tectonic activities (Yang et al., 2008). The rocks in the zone are severely weathered and fragmented.

Related Stratigraphy. The stratigraphic units in the region belong to the Beishan stratigraphic division of the Tarim North Rim–Beishan stratigraphic area in the Tarim region (Wang, 1996). The exposed strata mainly consist of the Hutuo Tianhu Rock Group, the Cambrian Pochengshan Formation, the Lower Silurian Heijianshan Formation, the Jixian Pingtoushan Formation, the lower Permian Shuangbaotang Formation, the Upper Permian Hongyanjing Formation, middle-upper Pleistocene diluvium, and Pleistocene alluvial diluvium. The strata are generally distributed in an east-west direction. The Tianhu East deposit occurs in the upper section of the Cambrian Pochengshan Formation (figure 3).
The Cambrian Pochengshan Formation can be broadly divided into upper and lower lithological segments. The lower segment is primarily a set of rock assemblages consisting of siliceous rocks intercalated with carbonate rocks. The lithology is mainly light gray to gray schistoid siliceous rock and gray to dark gray siliceous rock intermixed with gray-white to light gray schistose crystalline limestone. The upper section is primarily a set of fine clastic rocks intercalated with carbonate rocks, siliceous slates, and siliceous rocks. Here the lithology is mainly gray schistose siltstone intercalated with gray thin silty shale, gray-brown calcareous siltstone, dark gray siliceous rock, and a small amount of light gray-yellow silicified crystalline limestone. The siliceous slate underwent both pyritization and limonization. The formation was subjected to two-stage compression and affected by later faults, resulting in significant formation extrusion and deformation (Xinjiang Uyghur Autonomous Region Bureau of Geology and Mineral Resources, 1993; Yang et al., 2008).
Regional Magmatic Rocks. These are mainly Variscan intermediate-acid magmatic rocks with numerous Carboniferous and Permian intrusions and a small number of Devonian intrusions. The predominant rock types are monzogranite and diorite, accompanied by minor granite and quartz veins. The magmatic rocks are generally distributed in a NWW to nearly EW direction. The formation sequence of magmatic rocks was Devonian diorite, Carboniferous monzogranite, Permian diorite, and then Permian monzogranite.
Metamorphism. The contact metamorphism in the area occurred mainly between magmatic rock and surrounding rock. This process caused crystallization and recrystallization of the surrounding rock. The lithology exposed in the mining area is primarily from regional low-temperature dynamic metamorphism.

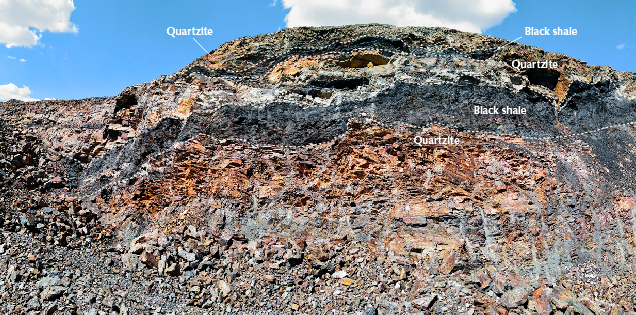

Occurrence. Tianhu East turquoise is found in a previously excavated outcrop, where it is hosted by quartzite (figure 4A) with minor turquoise filling in the shear joints. The turquoise occurs mainly as veins (up to 8 mm thick; figure 4B) and nodules (approximately 3–5 cm in diameter; figure 4C) of high density and good color. Its color range includes blue, greenish blue, and light green. Few pale chalky materials are found in this deposit. The top and bottom parts of the rocky outcrop are covered by quartzite (figure 5), which usually displays rhythmic stratification (0.5–5.0 cm). The quartzite is mostly quartz (~90%) with minor muscovite and has undergone limonization. The middle portion of the outcrops is black shale, which contains carbon-rich minerals and stains easily. The black shale contains silicified carbonaceous slate, siliceous slate, and schist, all strongly weathered. The clastic components of black shale are mainly argillaceous and clay minerals. In Tianhu East, turquoise is confined to the quartzite, and none is found in the black shale (figure 6). This distribution is distinct from the deposits in Hubei and Shaanxi, where turquoise is primarily hosted in black shale.
MATERIALS AND METHODS
Specimens. For this study, 42 pieces of rough turquoise were collected from Tianhu East during field exploration in 2017. They were named HM001 to HM042, indicating samples collected from Hami. All 42 pieces (some of which are shown in figure 7) were cut and polished into slabs measuring 0.5–0.8 mm thick and weighing 1.14–8.79 g for standard gemological testing, Raman spectroscopy, and laser ablation–inductively coupled plasma–mass spectrometry (LA-ICP-MS). From these, five samples were selected for field emission scanning electron microscopy (FESEM) and ten samples for EPMA.

Four samples of black shale and six samples of quartzite collected from the deposit were prepared as polished thin sections and bulk powders (200 mesh) for petrographic, quantitative mineral, and chemical analyses. Petrographic examinations were performed on the thin sections using a Leica DM2500P polarizing microscope. The bedrocks were prepared with fusion sampling, a technique used in analytical chemistry and materials science to melt and prepare solid samples into homogeneous powders for analysis by various analytical instruments. The major and trace elements of the bedrocks were analyzed with the whole rock analytical method using a Shimadzu XRF-1800 X-ray fluorescence spectrometer, a Thermo Scientific X2 inductively coupled plasma–mass spectrometer, a Thermo Scientific iCAP6300 inductively coupled plasma–optical emission spectrometer (ICP-OES), and a CCD-I powder solid injection arc emission spectrometer developed by the Hubei Geological Research Laboratory.
Standard Gemological Testing. Specific gravity of the 42 samples was determined hydrostatically with an electronic balance. Ultraviolet fluorescence reactions were observed under long-wave (365 nm) and short-wave (254 nm) UV from a mercury lamp. Microscopic features were observed and photographed with a Leica M205A microscope. Testing was performed at the Gemmological Institute, China University of Geosciences in Wuhan.
Micro-Raman Analysis. Micro-Raman spectroscopy was conducted on the 42 turquoise samples using a Bruker Optics Senterra R200L with a 532 nm laser. The laser power was 20 mW, and the spectral resolution was set at approximately 9–15 cm–1. In all, 20 scans were performed with a 5 s integration time for each scan. The mineral phases were identified by comparison with reference spectra from the RRUFF database at http://rruff.info; see Lafuente et al. (2016).
FESEM. The microstructural morphologies of five samples with different color and texture were investigated using a Zeiss Gemini Sigma 300 high-resolution FESEM with a secondary electron detector. Samples were coated with platinum (7 nm thickness) to reduce charging. SEM images were collected at an accelerating voltage of 10 kV and high vacuum mode.
EPMA. Backscattered electron (BSE) imaging, EPMA, and element mapping were performed on 10 turquoise specimens of different color as well as 10 bedrocks using a JEOL JXA-8230 microprobe with four wavelength-dispersive spectrometers (WDS) at the Center for Global Tectonics, School of Earth Sciences, China University of Geosciences in Wuhan. The operating conditions for quantitative analysis were: 15 kV accelerating voltage, 20 nA probe current, and 1 μm beam diameter. Dwell times were 10 s on element peaks and half that on background locations adjacent to peaks. Raw X-ray intensities were corrected using a ZAF (atomic number, absorption, fluorescence) correction procedure. A series of natural and synthetic standards were utilized for calibration: jadeite for sodium, pyrope for magnesium and aluminum, orthoclase for silicon and potassium, apatite for phosphorus, diopside for calcium, magnetite for iron, chalcopyrite for copper, and sphalerite for zinc. The compositional ranges and mean values of the tested samples were recorded. 15 kV accelerating voltage, 100 nA probe current, 1 × 1 μm2 pixel size, and stage scan model were utilized during EPMA mapping. EPMA stage mapping was performed at a relatively high probe current to compensate for reduced pixel dwell time and to acquire a higher spatial resolution. All mapping time was spent at the WDS X-ray peak positions.
LA-ICP-MS. The trace elements of the 42 turquoise samples (two spots per sample) were analyzed by an Agilent 7700e ICP-MS combined with a GeoLasPro laser ablation system consisting of a COMPexPro 102 ArF excimer laser (wavelength of 193 nm and maximum energy of 200 mJ) and a MicroLas optical system. Analytical conditions consisted of a 44 μm diameter laser spot size, a laser frequency of 6 Hz, an 80 mJ laser energy, an energy density of 5.5 J/cm2, and a dwell time of 6 microseconds. National Institute of Standards and Technology (NIST) Standard Reference Material (SRM) 610 glass and U.S. Geological Survey (USGS) glass standards BHVO-2G, BCR-2G, and BIR-1G were used as external standards. Due to the lack of a phosphate standard, the element homogeneity and stability of the specimens was evaluated, which was used as a measurement standard (not a calibration standard) to monitor the drift of the instrument and ensure the validity and accuracy of the data obtained.
RESULTS
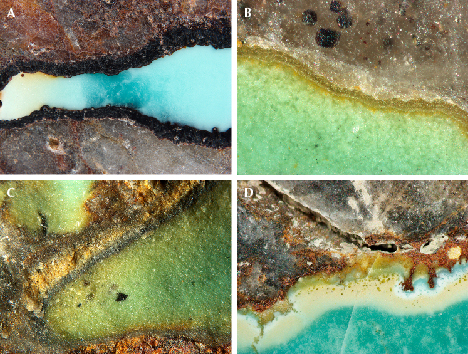
Gemological Properties. The Tianhu East turquoise displayed various colors: blue, greenish blue, green, and yellowish green. All samples were opaque and inert to both long-wave and short-wave UV radiation. The specimens had waxy to glassy luster and a wide range of specific gravity (2.51–3.38), as most samples were composed of turquoise and matrix. These laminar specimens had thicknesses of 0.6–7.0 mm in the siliceous matrix (figure 8A). Goethite, apatite, and svanbergite occurred between the turquoise and the siliceous matrix, exhibiting a banded or layered structure (figure 8, A–D). The inner black or red-brown layers often consisted of iron minerals with oolitic shapes. Iron-bearing pigments scattered throughout the turquoise were responsible for its brownish color (figure 8D). Tiny round inclusions were clustered at the border between the matrix and turquoise (figure 8D).

Chemical Composition. The ideal chemical formula of turquoise is [A B6(PO4)4(OH)8•4H2O], with Cu2+ at the A position and Al3+ at the B position (Foord and Taggart, 1998). Tianhu East turquoise contained major amounts of Al2O3, P2O5, CuO, and FeO, with minor contents of SiO2, ZnO, CaO, Na2O, and K2O (table 1). The compositions varied, with wide ranges of CuO (6.37–8.74 wt.%), Al2O3 (32.68–37.62 wt.%), P2O5 (30.74–36.54 wt.%), and FeO (0.76–5.67 wt.%). Higher FeO (4.06–5.67 wt.%) contents combined with lower Al2O3 (32.68–35.02 wt.%) and P2O5 (30.74–33.67 wt.%) contents were obtained from the yellowish green samples. The rest of the samples had narrow ranges of Al2O3 (36.10–37.62 wt.%), P2O5 (34.26–36.54 wt.%), and FeO (0.76–2.91 wt.%).
Cations per formula unit of turquoise were calculated based on 16 oxygen atoms (O) and 8 hydroxide groups (OH) (see table S-1 in appendix 1). Tianhu East turquoise was characterized by 0.6547–0.8735 atoms per formula unit (apfu) of Cu2+, 0.0064–0.0556 apfu of Zn2+, 0–0.2671 apfu of Fe2+, 0.0087–0.0552 apfu of Ca2+, 0.0170–0.1368 apfu of Na+, 0.0055–0.0391 apfu of K+, 5.2059–5.9439 apfu of Al3+, and 0–0.6411 apfu of Fe3+ at the B site. Also, the ranges of P5+ and Si4+ were 3.5176–4.0872 and 0.0041–0.7641 apfu, respectively. In this study, the A site was mostly filled with Cu2+, with the rest occupied by Zn2+, Fe2+, Ca2+, Na+, and K+. Al3+ and Fe3+ occurred at the B site. Si4+ was assigned to the P site since phosphorus can be substituted by silicon in the turquoise structure (Abdu et al., 2011). Accordingly, the chemical formula of the analyzed turquoise (e.g., sample HM010) can be expressed as (Cu0.8735Zn0.0128Fe0.0735Ca0.0117Na0.017K0.0071)∑=0.9956(Al5.8783Fe0.1041)∑=5.9824(P3.9977Si0.0243)∑=4.0220O16(OH)8•4H2O, indicating the samples analyzed by EPMA belong to the turquoise end-member.


Trace Element Chemistry. Trace elements were determined from 42 samples by LA-ICP-MS, with two analysis points (often in different color zones) per sample. This resulted in 82 total data points (two invalid data points were excluded). Trace elements of lithium, vanadium, chromium, gallium, strontium, and barium showed large variations in concentration (table 2).
Lithium concentrations (0.90–583 ppm, avg. 237 ppm) were slightly lower in Tianhu East turquoise than in French turquoise from Montebras Creuse (Rossi et al., 2017) but higher than those from China’s Hubei, Shaanxi, and Anhui provinces (Wang et al., 2007; She et al., 2009) and from Santa Fe in New Mexico (Rossi et al., 2017). Tianhu East turquoise had high vanadium (avg. 560 ppm) and chromium (avg. 2482 ppm) contents, which were higher than those in Anhui (Shen, 2020a), the Sinai Peninsula, Santa Fe, Montebras Creuse, and Neyshabur (Rossi et al., 2017). The samples’ gallium content (4.97–1487 ppm) overlapped with that of turquoise from other deposits except Neyshabur (Rossi et al., 2017), and the average gallium value (269.75 ppm) was higher than the others. Tianhu East turquoise had higher strontium content (4.07–545 ppm, avg. 269.75 ppm) compared to Tongling (J. Liu et al., 2019) but much lower than from Xichuan (X.T. Li et al., 2019), Sinai, and Santa Fe (Rossi et al., 2017). Barium content (23.47–781 ppm, avg. 260.62 ppm) overlapped with that of turquoise from most deposits but was lower compared to turquoise from Hubei and Shaanxi provinces (Wang et al., 2007) and Sinai (Rossi et al., 2017). Since most previous investigations of turquoise from other deposits were on a limited scale or only reported one data point, such as studies on turquoise from Sinai, Santa Fe, Montebras, and Neyshabur (Rossi et al., 2017), they were unable to determine the geographic origin based on trace element profiles and required additional research data.
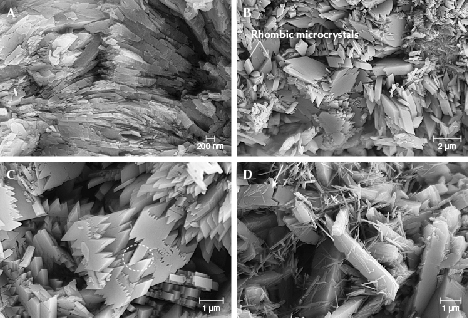
Microstructure. Platy, long columnar, laminar, rhombic, and rhomboidal structures were observed in SEM images (figure 9). One blue specimen revealed a compact platy structure consisting of closely stacked plate-like crystals with few pores (see figure S-1A in the appendix). By comparison, turquoise specimens with light blue or light green color contained numerous pores among microcrystals (figure 9, B–D). Some long columnar microcrystals were distributed radially in one light blue specimen (see figure S-1B in the appendix).
One light green turquoise sample had platy and laminar structures, with some microcrystals arranged locally in parallel (figure 9A). Interestingly, two shapes of platy microcrystals were observed in this specimen: rhombic and rhomboidal (figure 9, B and C). The rhombic platy microcrystals ranged from approximately 0.42–2.40 μm in length but showed only a slight variation in thickness (average 0.38 μm) (figure 9B). Most of them were disordered and partially parallel. The rhomboidal platy microcrystals had jagged edges that varied in length (figure 9C). Occasionally, two rhomboidal platy microcrystals were intergrown (figure 9C). Both the rhombic and the rhomboidal platy microcrystals had particularly sharp edges and a clear outline.
Two structures coexisted in one light yellowish green specimen: large columnar microcrystals and tiny columnar microcrystals (figure 9D). The large columns varied from approximately 4–8 μm in length and 0.5–1.6 μm in width, and some were up to 13 μm long. Occasionally, these large columnar microcrystals were distorted and broken (figure 9D). Under magnification, many of the tiny columnar microcrystals were sparsely scattered over the large columnar microcrystals (figure 9D), while some were clustered together. The tiny microcrystals generally had similar thickness (about 80 nm) and were less than 1.5 μm in length. Both the large and the tiny columnar microcrystals had a well-defined shape, sharp edges, and a clear outline. These structures were disorderly and loosely stacked together, with large pores clearly observed between them.
Mineral Associations. Tianhu East turquoise was associated with various minerals, such as quartz, apatite, goethite, hematite, jarosite, bonattite, muscovite, atacamite, svanbergite, and gypsum. These associated minerals were identified using Raman spectroscopy and EPMA-EDS.


Quartz. The most common mineral inclusion was transparent and colorless to gray quartz, up to 1.9 mm in length. Well-developed quartz crystals occurred as euhedral and pyramidal trigonal habits with transverse growth patterns (figure 10). The crystals were identified as quartz based on their Raman spectra, with bands at 127, 205, 263, 355, 395, 464, 695, and 805 cm–1 (figure 11, left).
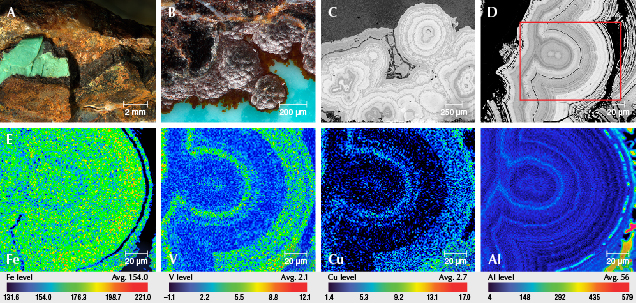
Goethite [FeO(OH)]. Goethite, identified by Raman spectroscopy (again, see figure 11, left), typically covered the surface of the turquoise with a thickness of 0.232–1.383 mm (figure 12A). Its Raman spectrum showed main bands at 240, 297, 398, 549, 678, and 1295 cm–1. Oolite-like goethite was characterized by oscillatory zoning, with some zones displaying concentric layers under EPMA-BSE imaging (figure 12, B–D).
Furthermore, EPMA element mapping analysis revealed that the goethite exhibited uneven distributions of elemental contents, manifested in distinct band patterns of iron, vanadium, copper, phosphorus, aluminum, silicon, sulfur, and zinc. The elemental variations and distributions resulted in a core/rim structure with varying gray values in BSE images, indicating different generations of goethite (figure 12, C and D). The high concentrations of iron, vanadium, copper, and phosphorus were in the outer part of the goethite crystal, which appeared bright gray in the BSE images owing to these elements’ low mean atomic number. Conversely, the inner part of the goethite crystal (which appeared dark in the BSE images) had low concentrations of iron, vanadium, copper, and phosphorus but high concentrations of aluminum, silicon, and sulfur (figure 12E). Variations in zinc content were less obvious than those of iron, vanadium, copper, phosphorus, aluminum, silicon, and sulfur (for element maps of phosphorus, silicon, sulfur, and zinc, see figure S-2 in the appendix).

Atacamite [Cu2Cl(OH)3]. Atacamite usually occurred in the host rock, occasionally associated with turquoise or quartz (figure 13). This mineral, rarely found in turquoise, is transparent and bright green and can resemble emerald in color. The atacamite crystals often displayed elongate columnar or irregularly granular forms up to 3.134 mm. EPMA analysis identified major contents of CuO (70.68–71.59 wt.%) and Cl (12.84–12.99 wt.%) (see table S-2 in the appendix). Its Raman spectrum showed prominent bands at 119, 145, 354, 459, 511, 583, 818, 909, 972, 3211, 3346, and 3431 cm–1 (figure 11, right). The Raman and EPMA results were both consistent with the atacamite reference in the RRUFF database.
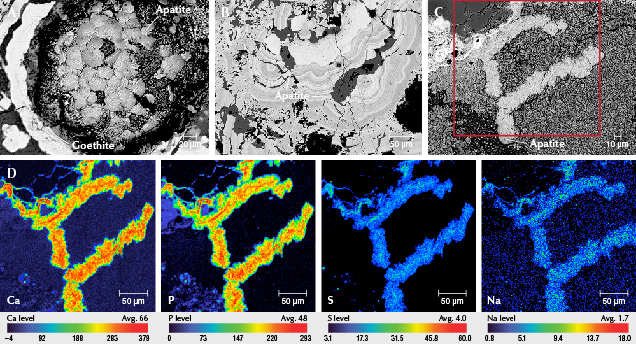
Apatite [Ca5(PO4)3F]. Apatite was also identified by Raman spectroscopy. Its Raman spectrum matched that of fluorapatite, with prominent bands at 404, 432, 583, 607, 690, 963, 1005, and 1073 cm–1 (figure 11, left). The apatite had different forms with variable chemical compositions, some precipitating as sulfur-rich apatite and some containing iron and sodium (see table S-3 in the appendix). It often occurred as irregular particles, fine veins, and long prismatic crystals cementing the goethite fragments (figure 14D). Tabular and euhedral microcrystalline apatite, crystallized as perfect flaky hexagonal crystals stacked in the hollow core of goethite, were observed in one sample (figure 14A). Vermicular crystals of apatite were also observed in the turquoise matrix using microscopy and BSE imaging (figure 14C). EPMA mapping showed that these vermicular apatite crystals contained abundant calcium and phosphorus, as well as minor sodium, sulfur, and antimony (figure 14). The high concentrations of calcium, phosphorus, sodium, sulfur, and antimony were the opposite of the low aluminum, silicon, and iron contents (see figure S-3 in the appendix). The distribution of element concentrations closely matched the apatite’s vermicular form.

A mixture of apatite and turquoise was also identified in Tianhu East samples (figure 15). Round inclusions usually occurred in groups or clusters at the border between the turquoise and its matrix. They displayed a wide range of colors: blue, bluish green, and yellowish green. Ranging from 10 to 139 μm in diameter, they were not easily visible without magnification. When the samples were prepared as thin sections for electron probe measurements, the turquoise areas were opaque. Parts of the round inclusions (the mixture of turquoise and apatite) were transparent under transmitted light, while the other parts were opaque (figure 15B). EPMA-BSE imaging revealed that these transparent parts were brighter than the opaque parts (figure 15C). Nevertheless, both the transparent and the opaque parts were identified as a mixture of fluorapatite and turquoise. Their spectra exhibit the Raman shifts typical of turquoise and a dominant band at 964 cm–1 (figure 11, right).
The EPMA and element mapping results clearly showed that in the round inclusions, the transparent portions had higher concentrations of CaO (8.09 wt.%) and fluorine (0.91 wt.%) than the opaque portions but lower Al2O3 (31.00 wt.%), CuO (6.73% wt.%), and P2O5 (34.21 wt.%) (see table S-2 in the appendix). This was caused by the large amount of apatite and small amount of turquoise in the transparent portions. The transparency of the round inclusions was associated with the ratio of apatite to turquoise. Element mapping highlighted the different element distributions between the turquoise parts and the round inclusions (see figure S-4 in the appendix). The round inclusions had higher calcium, phosphorus, and fluorine contents but lower aluminum, copper, and iron. The differences for calcium and phosphorus were the most pronounced. Element mapping also revealed that calcium and aluminum were unevenly distributed within the round inclusions.

Svanbergite [SrAl3(PO4)(SO4)(OH6)]. These opaque crystals were found in a wide range of colors (beige, brownish yellow, and bluish white) and occurred together with turquoise, goethite, or quartz (figure 16A). The Raman spectrum for svanbergite was inconclusive, with bands at 185, 254, 373, 468, 518, 616, 698, 988, 1026, 1108, 3189, and 3465 cm–1 (figure 11, right). The major compositions obtained by EPMA-EDS were Al2O3 (42.17 wt.%), P2O5 (26.23 wt.%), SO3 (8.11 wt.%), CaO (10.95 wt.%), SrO (10.12 wt.%), and FeO (1.75 wt.%) (see table S-3 in the appendix). Svanbergite was often associated and mixed with apatite, occurring as spots, veins, or irregular fragments embedded in turquoise, svanbergite, or goethite (figure 16, B and C). The mixture of svanbergite and apatite exhibited the combined Raman shifts and mixed compounds when analyzed by Raman spectroscopy and EPMA-EDS, respectively. Mixtures of turquoise and svanbergite and of turquoise, apatite, and svanbergite were also detected by Raman spectroscopy and EPMA-EDS.


Jarosite [KFe3+3(SO4)2(OH)6]. Because of its lower mean atomic number, jarosite appeared brighter than turquoise in BSE images (figure 17A). The Raman results showed the combined characteristics of turquoise and jarosite, with peaks at 138, 222, 433, 571, 624, 1006, 1103, and 1154 cm–1 (figure 18). The chemical compositions were characterized by rich sulfur, potassium, and iron in addition to Al2O3, P2O5, and CuO. The concentrations obtained by EPMA-EDS were 14.06–15.95 wt.% for SO3 and 3.65–4.49 wt.% for K2O. FeO ranged from 22.69 to 24.93 wt.% (see table S-3 in the appendix).
Bonattite [CuSO4• •3H2O]. In the rough turquoise samples, a semitransparent milky mineral with a waxy luster appeared as fillers in the fissures or wedge-shaped cavities of goethite (figure 17B). This mineral occurred as irregular forms or veins, up to approximately 2 mm in length, and was identified by Raman spectrometry as bonattite.
Muscovite [KAl2(Si3Al)O10(OH)2]. The mineral muscovite was easily found in the matrix of rough samples. It was colorless and transparent, with perfect cleavage and glassy luster (figure 17C) and main Raman bands at 260, 400, and 703 cm–1.
Generally, Tianhu East turquoise samples from the primary occurrence were accompanied by a variety of minerals. In addition to the minerals mentioned above, others such as hematite (Fe2O3) (figure 18) and gypsum [Ca(SO4)•2H2O] were also identified by Raman analysis.
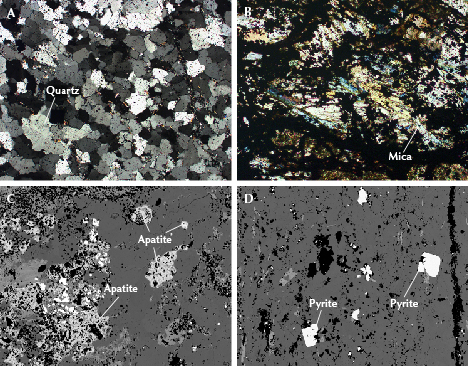
Evidence of Elemental Sources for Turquoise Formation. Petrography and Mineralogy. The quartzite samples were composed mainly of quartz (>87%) (figure 19A) and muscovite, as well as minor jarosite, gypsum, and goethite. The black shale consisted of quartz (13–75%), muscovite (6–74%) (figure 19B), jarosite, montmorillonite, goethite, and kaolinite. Apatite and pyrite were also detected in both quartzite and black shale by EPMA (see table S-4 in the appendix) and Raman analysis. The apatite was often irregular and toothed along the vermicular edge and occasionally found as fine granular crystals (figure 19C). The pyrite had typical cubic forms (figure 19D).
Geochemistry. In bedrocks from the Tianhu East deposit, black shale had higher concentrations of Al2O3 (avg. 4.74 wt.%), P2O5 (avg. 1.74 wt.%), Fe2O3 (avg. 12.62 wt.%), and copper (avg. 164.2 ppm), but lower SiO2 content (avg. 59.69 wt.%), than those of quartzite (see table S-4 in the appendix). The geochemical characteristics of phosphorus, copper, and iron in black shale were especially noteworthy, attributed to the enrichment of various minerals (e.g., apatite and pyrite) and polymetallic elements. According to the geochemical data of stream sediments surveyed by Xu (2005), the range of copper (20–30 ppm) and phosphorus (473–553 ppm) varied greatly in Tianhu East, but the chemical gradient of Al2O3 (10.2–11.6%) was relatively small. The data for stream sediments demonstrate that aluminum is widespread in this region, while copper and phosphorus are limited. The contents of copper and phosphorus in Tianhu black shale were higher than those in stream sediments (Xu, 2005), while the range of copper in quartzite (avg. 30.28 ppm) was similar. The high concentrations of phosphorus and copper in black shale were vital to the turquoise mineralization.
DISCUSSION
Mineral Assemblages. Table 3 lists the various minerals associated with turquoise from worldwide deposits, allowing a comparison of the mineralogical variability in determining geographic origin. Quartz is the most common mineral found (Jiang et al., 1983; Hull et al., 2008; Taghipour and Mackizadeh, 2014; Luo et al., 2017; Rossi et al., 2017; X.T. Li et al., 2019; J. Liu et al., 2019; Shen and Zhao, 2019). Mixtures of apatite and turquoise occur as inclusions in turquoise from both Tianhu East and Hubei (L. Liu et al., 2020). Apatite is also present in turquoise from Anhui (Yang et al., 2003), New Mexico (Hull et al., 2008), and Neyshabur (Rossi et al., 2017). The presence of goethite and hematite in the present study is consistent with iron oxides, as previously reported (Jiang et al., 1983; Tu, 1996; Hull et al., 2008; Taghipour and Mackizadeh, 2014; Luo et al., 2017; X.T. Li et al., 2019; Shen and Zhao, 2019). Jarosite has also been identified in turquoise from the Bijiashan mine in Anhui Province (Shen and Zhao, 2019), as well as Shaanxi and Hubei (Jiang et al., 1983; Tu, 1996, 1997a), and Damghan, Iran (Taghipour and Mackizadeh, 2014). Bonattite [CuSO4•3H2O] was found in the Tianhu East samples. The coexistence of svanbergite and turquoise is found in turquoise from both Tianhu East and Xichuan, Henan Province (X.T. Li et al., 2019). Nevertheless, the occurrence of other aluminum phosphate-sulfate minerals (e.g., woodhouseite, crandallite, alunite, and goyazite) has been documented at turquoise deposits in Shaanxi and Hubei (Jiang et al., 1983; Shi and Cai, 2008; Shi et al., 2008), the Sinai Peninsula, and Khorasan, Iran (Rossi et al., 2017), but was not identified in our samples from this study.

Notably, the presence of atacamite separates Tianhu East turquoise from other Chinese turquoise. This is because it has never been reported previously from other Chinese deposits, but only from the Iron Mask mine in Orogrande, New Mexico (Crook and Lueth, 2014). Atacamite is a supergene product of the oxidation of copper deposits (Arcuri and Brimhall, 2003; Cameron et al., 2007) under arid and saline conditions. The Tianhu East deposit lies in the Gobi Desert region, which is characterized by a lack of moisture, high temperatures, and extreme temperature swings. It seems logical that atacamite is only found in Hami and not in China’s other turquoise deposits.
Mineralogical variability also indicated the physical and chemical conditions of turquoise formation. The presence of jarosite and goethite suggests that Tianhu East turquoise formed in an acidic oxidizing environment (Jiang et al., 1983; Crook and Lueth, 2014). The paragenetic assemblage of svanbergite, jarosite, gypsum, and bonattite in turquoise from Tianhu East suggests high sulfur fugacity in the deposit.
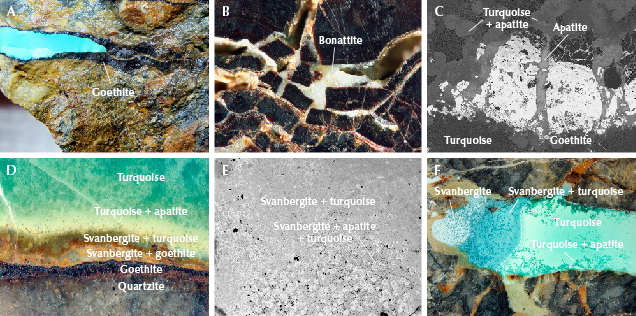
Mineral Crystallization Sequence. Quartz, muscovite, and pyrite were the rock-forming minerals at Tianhu East. Apatite was formed in black shale during early diagenesis. The fractures of quartzite were initially filled by goethite and later by turquoise (figure 20A). It should be noted that bonattite precipitated in the cavities and fissures of goethite (figures 17B and 20B), indicating that it formed after goethite. The formation of bonattite demonstrates the availability of copper in the weathering solutions (Chavez, 2000).
Magnification revealed that goethite, secondary apatite, svanbergite, turquoise, and their mixtures (identified by Raman spectroscopy) precipitated successively in quartzite to form a layered structure (figure 20D). Apatite crystals formed in the fissures and cavities of goethite (figure 14, A and B). BSE images show apatite veinlets interspersed across goethite with reaction edges (figure 20C). Svanbergite mixed with goethite appeared as a yellow layer 0.38 mm thick (figure 20D). The svanbergite and turquoise mixture appeared in the middle of the green layers, followed by small grains of the turquoise and apatite mixture. Thus, the paragenetic sequences suggest that precipitation of svanbergite and apatite occurred after goethite but preceded turquoise.
Svanbergite was intimately intergrown with apatite. This mixture occurred as small blue inclusions dispersed within the svanbergite (figure 16B), indicating that the formation of svanbergite and apatite was nearly simultaneous. Additionally, turquoise coprecipitated with svanbergite and apatite (figure 20, D–F), creating mottled aggregates that are difficult to separate from each other. The paragenetic relationship reveals that the precipitation of svanbergite and apatite briefly overlapped with turquoise, with both minerals forming slightly earlier than turquoise during the preliminary period.
The apatite would have dissolved within an acidic weathering solution (Guidry and Mackenzie, 2003; Salama, 2014). The initial weathering solutions were acidic but would have become slightly alkaline after reacting with the diagenetic apatite (Salama, 2014). Under alkaline conditions, secondary apatite reprecipitated as filling phases in goethite when the weathering solutions were leached out. Svanbergite is more stable than apatite under acidic conditions (Salama, 2014; Vircava et al., 2015) and would have precipitated with decreasing pH of the weathering solution (Vircava et al., 2015). The formation of turquoise was possible when the weathering solutions became more acidic (pH = 4.45) (Spier et al., 2020) and had a high enough concentration of Cu2+. The textural relationships and crystallization sequence of apatite, svanbergite, and turquoise also suggest that the turquoise precipitated from a more acidic solution than those of apatite and svanbergite.
The final period was the formation of minor minerals (hematite, jarosite, and atacamite). During the epigenetic weathering process, hematite and jarosite were typically dispersed in turquoise. Atacamite is usually recognized as a cavity-filling phase in turquoise or quartzite (figure 13), indicating a post-genetic relationship. After the formation of turquoise, the excess copper of the weathering solutions eventually transformed into atacamite. The presence of bonattite and atacamite confirmed significant enrichment of copper in the weathering solutions (Chavez, 2000; Crook and Lueth, 2014).

Accordingly, the minerals formed in three periods, according to mineral assemblages, as shown in figure 21.
Genesis and Elemental Derivation for Formation. Mineralogical and geochemical characteristics confirmed the supergene origin of Tianhu East turquoise. The formation process can be proposed as four stages:
Stage Ⅰ: Early Diagenesis. During regional dynamic metamorphism, metal sulfide (e.g., pyrite) was formed, and other minerals containing iron, copper, aluminum, and phosphorus accumulated in the strata.
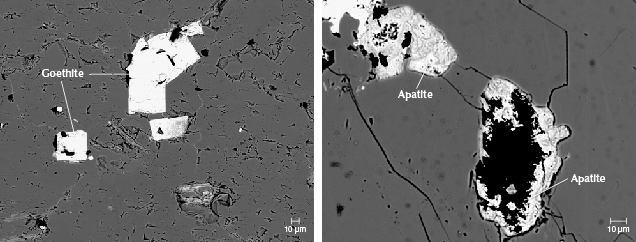
Stage Ⅱ: Weathering. Rock-forming minerals were subjected to weathering alteration when exposed to the supergene environment. During the weathering process, water and oxygen promoted the oxidation of metallic sulfides (e.g., pyrite), generating abundant sulfuric acid and creating an acidic environment (Crook and Lueth, 2014) that was beneficial to dissolving the essential elements of aluminum, phosphorus, and copper. Small, bright goethite crystals with pseudomorphic cubic forms in black shales were the oxidative product of pyrite (figure 22A). The acidic solutions facilitated the dissolution of apatite, releasing calcium and phosphorous (Guidry and Mackenzie, 2003). BSE images show that most diagenetic apatite in black shales has an incomplete shape with toothed edges and numerous cavities (figure 22B), indicating partial dissolution (Crook and Lueth, 2014).
Stage Ⅲ: Leaching and Migration. Due to multiphase tectonic activities, fractures were well developed, especially in quartzite. Aluminum, phosphorus, and copper were subsequently leached from the rocks and concentrated in the weathering solutions, leaching downward and migrating along structural fractures of the quartzite. These fractures provided space for the precipitation of the solutions, enabling the crystallization and mineralization of turquoise.
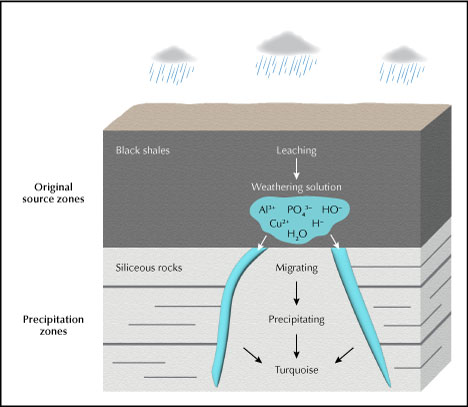
Stage Ⅳ: Precipitation and Turquoise Formation. Finally, turquoise precipitated and formed as veins and nodules within the structural fractures of quartzite (figure 23).
Several studies have reported that connate waters, descending meteoric water, and surface waters were favorable to the formation of turquoise (Pogue, 1915; Tu, 1997a,b; Hull et al., 2008; Taghipour and Mackizadeh, 2014). We propose that descending meteoric water was mainly responsible for the formation of Tianhu East turquoise, since the deposit lies in a region with a dry climate. There is little perennial surface-streaming water in the area (Chen, 2016; Zhang, 2020), and aluminum is abundant. Sufficient alumina for turquoise formation was released from muscovite or sericite during the weathering process of the rocks. Phosphorus was derived mainly from diagenetic apatite hosted in the black shale. Copper-bearing minerals dispersed within the black shale were probably the source of copper (Pogue, 1915; Spier et al., 2020), as evidenced by the excess copper content in the black shales and the formation of bonattite and atacamite.
CONCLUSIONS
Tianhu East turquoise has significant geological and gemological value. The samples in this study had platy, long columnar, laminar, rhombic, and rhomboidal microstructures and were characterized by high lithium, vanadium, chromium, strontium, and gallium contents along with relatively low barium. Turquoise veins at the deposit are hosted by quartzite and accompanied by abundant minerals, including quartz, apatite, goethite, hematite, jarosite, bonattite, muscovite, atacamite, svanbergite, and gypsum. Atacamite is a unique geographic indicator for the origin of turquoise at Tianhu East, separating it from other Chinese deposits. Textural relationships among the associated minerals also indicated the crystallization sequence that is essential to understanding turquoise formation. Mineralogical and geochemical characteristics confirmed that the elemental sources of turquoise were derived mainly from black shale due to the presence of the mineral suite (apatite, pyrite, and muscovite) within the rocky outcrop. This study proposes a hypothesis of supergene weathering origin for the Tianhu East deposit.


