Large CVD-Grown Diamond Resubmitted after HPHT Treatment
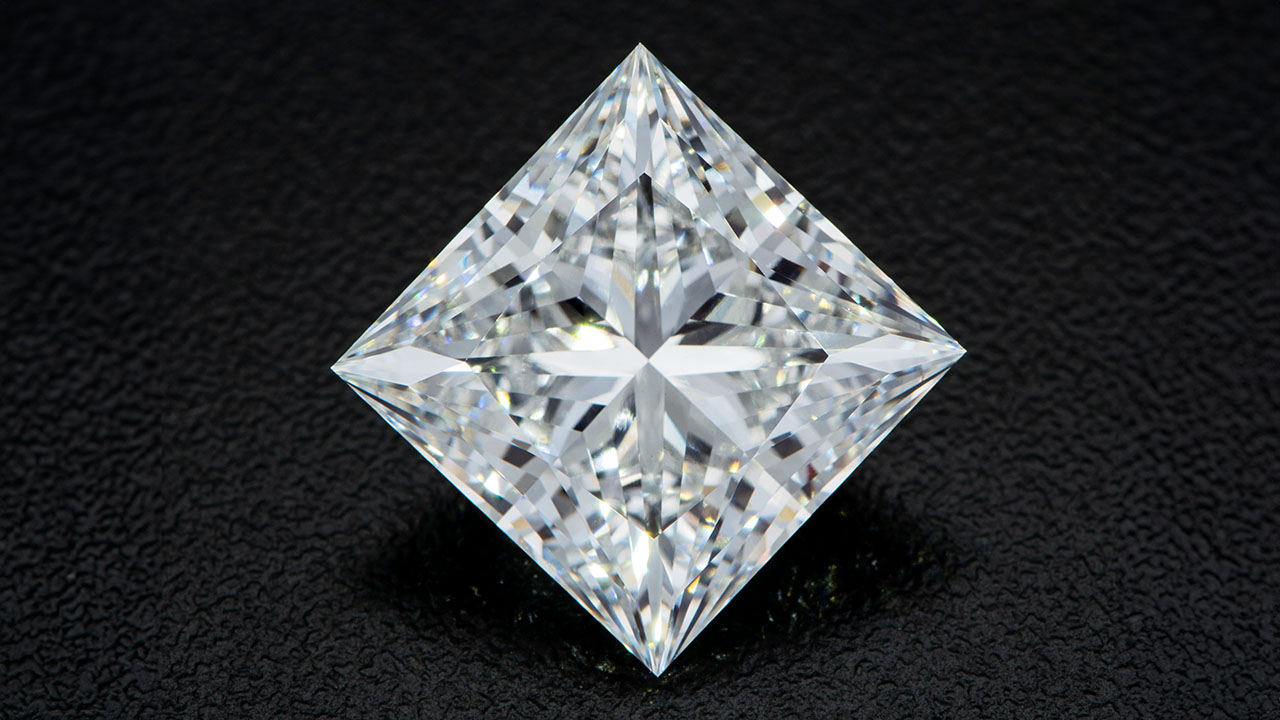
In January 2022, the record holder for largest diamond grown by chemical vapor deposition (CVD) was a 16.41 ct square modified brilliant with G color and VVS2 clarity that showed no indications of post-growth treatment (Spring 2022 Lab Notes, pp. 54–56). Recently, this diamond was resubmitted to the Carlsbad laboratory with a weight of 15.73 ct (figure 1). Standard data collection indicated that since the original submission, the stone had undergone high-pressure, high-temperature (HPHT) treatment. Consequently, this provided a case study showing the spectral and fluorescence differences between the as-grown and HPHT-treated versions. The color and clarity grades remained unchanged.
Although HPHT processing of CVD-grown diamonds is often performed to improve the color grade by reducing brown coloration (S. Eaton-Magaña and J.E. Shigley, “Observations on CVD-grown synthetic diamonds: A review,” Fall 2016 G&G, pp. 222–245), the diamond displayed no observable color improvement. It is also likely that the HPHT treatment created frosting of the facets that required repolishing, which could partially account for the 0.68 ct weight loss.
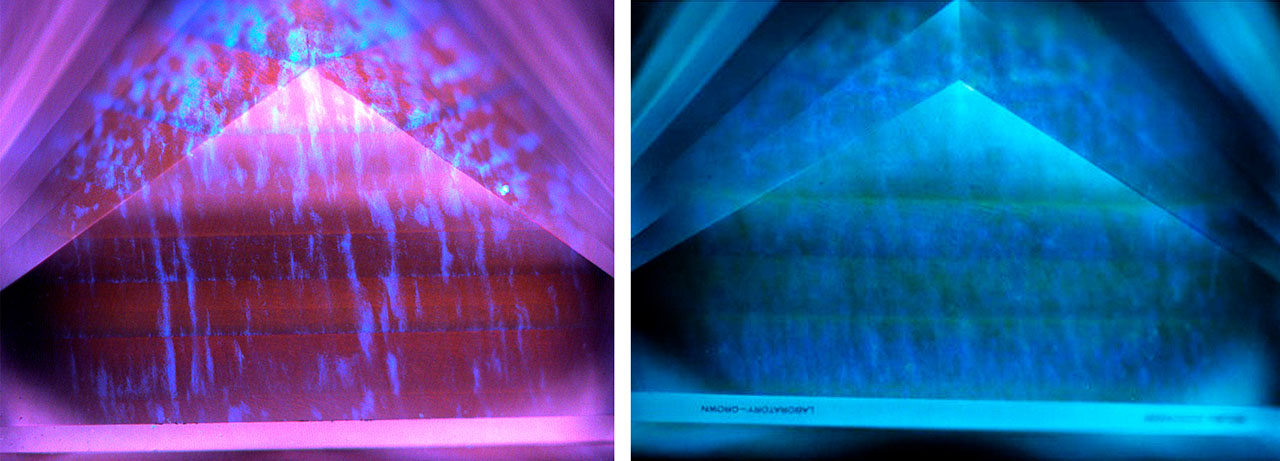

DiamondView fluorescence imaging showed pronounced differences between the as-grown and treated stages (figure 2). This color change in fluorescence imaging is often seen in HPHT-treated CVD-grown diamonds due to the reduction of nitrogen vacancy (NV) centers (NV0 with zero-phonon line [ZPL] at 575 nm and NV– at 637 nm) and an increase in H3 (NVN0; ZPL at 503.2 nm). The changes in the defect concentrations leading to the differences in the fluorescence colors were also evident in photoluminescence (PL) spectroscopy collected at liquid nitrogen temperature. Figure 3 shows the PL results with 514 and 457 nm excitation for the 16.41 and 15.73 ct stages of the diamond.
With HPHT treatment, there was a decrease in the NV centers and an increase in the silicon vacancy (SiV–) center at 737 nm in the 514 nm PL spectrum. In the 457 nm PL spectrum, the 468 nm peak and 3H peak (ZPL at 503.5 nm) were no longer detected, while features developed at 494.1, 500.4, and 506.2 nm along with the H3 peak at 503.2 nm.
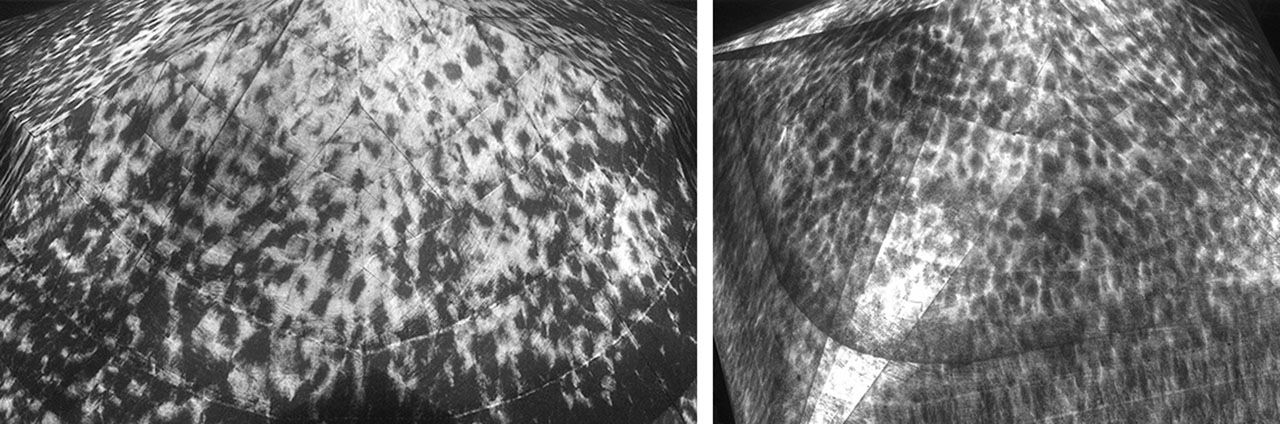
As expected with a treated CVD-grown diamond, there were no major changes in many of the growth features. The cathodoluminescence images in figure 4 show no observable differences; the black dots are associated with lattice dislocations. The seven growth interfaces seen in figures 2 and 4 appear unmodified.
This stone allowed for an interesting comparison of a CVD-grown diamond before and after commercial HPHT treatment.


