“Ice Jade” from Guatemala
ABSTRACT
“Ice jade” is a translucent variety of jadeite jade (also known as fei cui) that is generally of high value. Reportedly from the Morales mine in the Izabal Department of Guatemala, it has recently appeared in the Chinese jewelry market. In this study, the structural characteristics, mineral compositions, and color genesis of Guatemalan “ice jade” were studied using scanning electron microscopy, cathodoluminescence, X-ray diffraction, electron probe microanalysis, Raman spectroscopy, and ultraviolet/visible/near-infrared spectroscopy. “Ice jade” is composed almost exclusively of jadeite, with accessory minerals that include omphacite and albite. The chemical composition of the samples studied here was nearly pure sodium pyroxene. A small amount of fine-grained omphacite imparted a pale green color to this material. This “ice jade” exhibited fine-grained texture, occasionally with some micro-granular texture. Guatemalan “ice jade” has a unique characteristic appearance, microstructure, accessory minerals, and chemical compositions, but further study is needed to distinguish it from the other origins.
Jadeite jade, also called fei cui in China, is the most popular jade variety and one of the best-selling gems in China. Color and transparency are the primary quality factors that determine value. Jadeite jade is a polycrystalline aggregate, primarily consisting of jadeite (NaAlSi2O6) and including accessory minerals such as omphacite, albite, amphibole, and chromite (Harlow and Sorensen, 2005; Yuan, 2009). Gem-quality material is only found in a few countries, namely Myanmar, Guatemala, Russia, Kazakhstan, and Japan (Tsujimori and Harlow, 2012; Coccato et al., 2014; Abduriyim et al., 2017). Myanmar is the traditional and most important producer of gem-quality jadeite jade, while Guatemala has become the second-largest producer (Zhang and Shi, 2022).
From the thirteenth century to the early twenty-first century, the jadeite jade sold in China came exclusively from Myanmar (Hughes et al., 2000; Zhang, 2003). The use of jadeite jade in Central America can be traced back to 1500 BCE, but the specific source was not identified until more recently. In 1952, Robert Leslie, a researcher at the Smithsonian Institution, first found detrital nodules of jadeite in Guatemala (Foshag and Leslie, 1955). Over the next 50 years, geologists and locals discovered more jadeite mines there. After 2000, small amounts of Guatemalan material began to enter the Chinese market (Zhang, 2003). The mineral composition of different varieties of Guatemalan jadeite varies greatly. According to its main composition, it can be divided into three categories: jadeite jade, omphacite jade, and jadeite-omphacite jade. The major mineral of these three categories is jadeite, omphacite, and mixed-phase jadeite-omphacite, respectively (McClure, 2012; Lin et al., 2020). The color range of Guatemalan jadeite jade includes light to medium green, white, purple, and blue (Hargett, 1990; Abduriyim et al., 2017; Ouyang et al., 2017; Spring 2024 Gem News International, pp. 97–99). The Guatemalan jadeite jade initially sold in the Chinese market was coarsely grained and not transparent enough to be considered gem quality. Consequently, Guatemala was thought to produce low-quality material. But that has changed recently, as vivid green semitransparent as well as pale green translucent jadeite jade from Guatemala has entered the Chinese market (Wang et al., 2022).
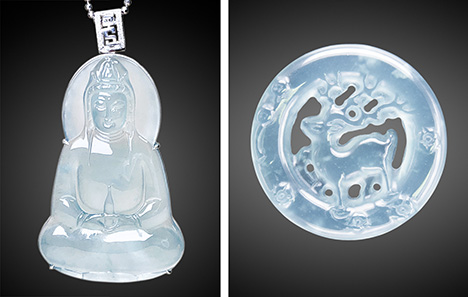
In the Chinese market, nearly colorless jadeite with fine texture and high transparency is called “ice jade.” A Guatemalan variety with a near-transparent appearance (figure 1) is called “white water jade” by Chinese sellers. This material is usually near-colorless with pale gray-green or pale gray-blue colors and often contains some white snowflake-shaped impurities. It has a fine texture, and the highest-value specimens are transparent. This article studies the gemological properties, textural characteristics, and mineral compositions of fine-quality “ice jade” from the Morales mine in Guatemala and aims to provide evidence that distinguishes it from similar Burmese material.
GEOLOGIC BACKGROUND
Guatemala is located in the northwest of Central America, bordering Mexico, Belize, Honduras, and El Salvador, and the Pacific Ocean to the south (figure 2). Jadeite jade occurs in tectonic serpentinites of the Motagua fault zone in Guatemala (Harlow et al., 2006). The Motagua fault zone is located in the collision zone of the North American–Caribbean plate and runs nearly parallel to the Polochíc fault zone in the north and the Jocotán fault zone in the south. The three faults form the Guatemala suture zone, which is considered a dividing line between the North American plate and the Caribbean plate (Brueckner et al., 2009; Yui et al., 2010). Jadeite jade is the product of fluid-mediated crystallization and/or metasomatism, and the formation of deposits is related to plate tectonic subduction zones (Sorensen et al., 2006; Tsujimori and Harlow, 2012; Flores et al., 2013).
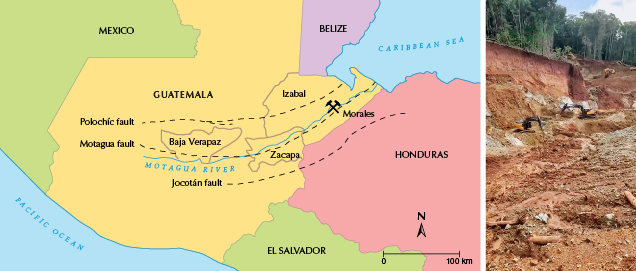
Guatemalan jadeite jade was first discovered north of the Motagua River Valley (Hargett, 1990; Gendron et al., 2002), mined from primary deposits or from scattered boulders in the rivers. The primary deposits occur in serpentinite mélanges as vein or tectonic inclusions, showing a jadeite-albite-serpentinite transition zonation (Harlow, 1994). The distribution range of Guatemalan jadeitite extends from the Baja Verapaz Department to the Zacapa Department, spanning 110 km on the north side of the Motagua River Valley (Harlow et al., 2011).
The occurrence extends east to the Izabal Department, which is located in the northeastern part of the Motagua fault zone and is a newer jadeite mining location (Harlow et al., 2011). The studied “ice jade” comes from the Morales mine in Izabal (figure 2). Morales lies in the strike-slip basin in the eastern Motagua River Valley. Nearby ophiolite outcrops recrystallized under the influence of low-grade metamorphism, and mantle serpentinite was strongly deformed by shearing action. Ophiolite outcrops record sinistral slip of the Motagua fault (Giunta et al., 2002; Marshall, 2007; Bartole et al., 2019). The jadeite jade ore occurs in the laterite layer, which was weathered from serpentinite (again, see figure 2).
MATERIALS AND METHODS
The Guatemalan “ice jade” samples were collected by author ZX through the long-term cooperation of a jade merchant, who reported that the raw material was produced from the Morales mine. The merchant obtains the rough from the original source and then processes and sells it in the jewelry market in the city of Jieyang in China’s Guangdong Province. The Jieyang market is one of four major trading centers for fine-quality jadeite in Guangdong. Guatemalan “ice jade” has good quality but usually sells for one-quarter to one-third the market price of its Burmese counterpart.
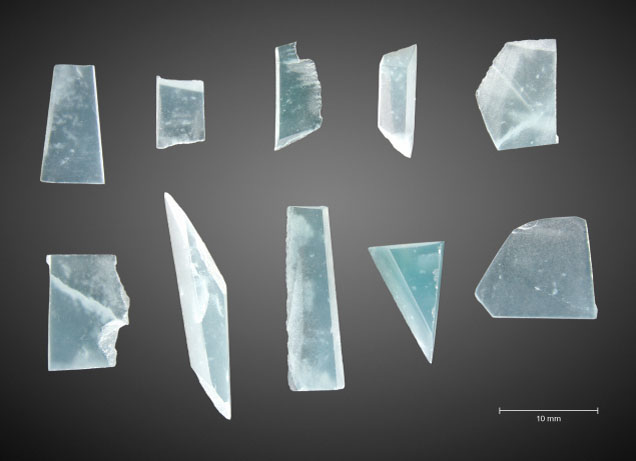
The samples shown in figure 3 were selected for spectroscopic, textural, and chemical composition analyses. The 10 samples, GB-1 to GB-10, weighed 0.086–0.770 g. The polished surface of each sample had a vitreous luster. A small number of white inclusions appeared to float on the surface like snowflakes. The mineral grains or texture were hard to detect without magnification, and all the samples had good transparency.
Analyses were done at the China University of Geosciences (CUG) in Wuhan. Standard gemological testing and photomicrography were performed at the Gemmological Institute, CUG. Refractive index was measured using a gemological refractometer, and specific gravity was determined using the hydrostatic method. Ultraviolet fluorescence was observed with UV lamps under long-wave (365 nm) and short-wave (254 nm). All samples and microscopic features were photographed and observed using a Leica M205A microscope camera. Diffuse reflectance ultraviolet/visible/near-infrared (UV-Vis-NIR) spectra were collected by a Skyray Instrument Gem UV-100 spectrometer, using an integrating sphere with a range of 200–1000 nm and an integration time of 100 ms, and eight cycles were collected for each spectrum.
X-ray diffraction (XRD) patterns were collected by a Bruker AXS D8 Advance X-ray powder diffractometer at the Faculty of Materials Science and Chemistry. The system was equipped with a copper target X-ray tube set to 40 kV and 40 mA. The scanning speed was 10°/min in the 2θ range of 3–70°, and fragments of the samples were pulverized into 200-mesh powder for the experiment.
Raman spectra of main minerals and inclusions were recorded using a Horiba-LabRAM HR Evolution Raman spectrometer and a Jasco NRS-7500 Raman spectrometer with a 532 nm solid state laser, an acquisition time of 15 s, and an accumulation of 3 scans in the range of 100–1500 cm–1. Chemical composition was analyzed using a JEOL JXA-8230 electron probe microanalysis (EPMA) system with a tungsten filament gun equipped with an X-ray wavelength-dispersive spectrometer. The voltage was set to 15 kV and the current to 20 nA, with a beam spot diameter of 1 μm. Measurement times were set at 10 s for the peak counts of each element. The system reported oxide test results after automatic ZAF (atomic number, absorption, fluorescence) correction. Jadeite (Na, Si), hematite (Fe), olivine (Mg), diopside (Ca), corundum (Al), chromite (Cr), rhodonite (Mn), potassium feldspar (K), and rutile (Ti) were used to calibrate the EPMA data. Backscattered electron (BSE) images of mineral structural characteristics were collected using a Thermo Fisher Helios G4 double-beam electron microscope at an accelerating voltage of 20 kV. The microscope was equipped with energy-dispersive X-ray spectroscopy (EDS) for simultaneous chemical analysis at a working voltage of 20 kV.
The experiments were completed at the State Key Laboratory of Geological Processes and Mineral Resources. Half of the samples (GB-1, GB-4, GB-5, GB-9, and GB-10) were randomly selected and fabricated into thin slices for chemical composition analysis and BSE images. The thin sections were sputtered with carbon film on the surface to enhance electrical conductivity before the EDS and EPMA experiments.
Color cathodoluminescence (CL) was observed at the School of Earth Sciences using a CITL CL8200 MK5-2 optical cathodoluminescence stage equipped with a Leica DM2700P polarizing microscope for imaging. The operating current was 250 μA, and the voltage was 12 kV.
RESULTS
Gemological Properties. Most Guatemalan “ice jade” sold in the market is nearly colorless or pale green, though some pale green samples have a light blue tone. The samples in this study were nearly colorless with very light greenish color, except for sample GB-9, which was bluish. White inclusions are common, and the presence of numerous white inclusions leads to a decrease in transparency. Compared with Guatemalan “ice jade,” Burmese material is colorless or nearly white (Tang, 2020).

The gemological properties of the 10 samples are summarized in table 1. They were transparent to semitransparent, with a refractive index of 1.66 and a specific gravity of 3.24–3.35. All the samples were inert under both long-wave and short-wave UV light.
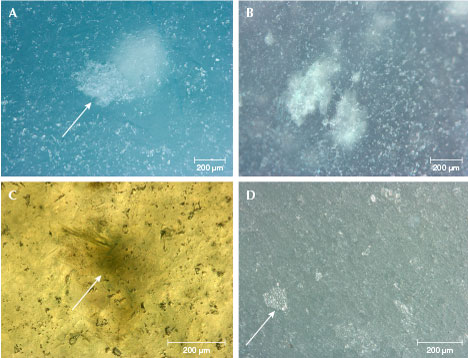
Microscopic Observation. Mineral grains were usually difficult to observe even by microscopy, indicating the fine texture of the samples. White inclusions were randomly distributed and occurred in two different sizes. The large ones were clustered like snowflakes, which could be observed without magnification (figures 1 and 3). They showed no crystallized shape under magnification. Some were exposed on the polished surface (figure 4A), displaying a cloudy appearance. This indicated that the large inclusions were composed of micro-crystals rather than formed by a single crystal. On the other hand, numerous microscopic colorless mineral grains were distributed throughout the matrix (figure 4, A and B). Other impurities such as grossular garnet and rutile were not found in the “ice” samples, although these characteristic inclusions have been reported in green and blue jadeite from Guatemala (Abduriyim et al., 2017).
Jadeite has two sets of cleavage, and the reflection of the cleavage plane can often be observed on the surface of the jadeite jade with a coarse or relatively coarse-grained texture, either visually or by microscopy. In the “ice jade” samples, the cleavage planes were difficult to observe on the polished surface, even with microscopy. Some tiny cleavage planes were observed on the unpolished surfaces. Relatively large cleavage planes were distributed sporadically on the surface; these were not complete cleavage planes but occurred as step-like breakages (figure 4D). This indicated that the jadeite crystals of large grain size were not intact crystals, but rather fragments broken along cleavage planes.

UV-Vis-NIR Spectroscopy. The diffuse reflectance UV-Vis-NIR spectra of the samples are shown in figure 5. All the samples had an absorption peak at 437 nm, which was the only absorption peak in the range of visible light (400–700 nm). The 437 nm absorption peak is related to trivalent iron ions (Fe3+) (Yuan et al., 2003; Lu, 2012).


X-ray Diffraction. XRD diffraction was used to obtain the overall mineral composition of the “ice jade” samples. Their XRD patterns are shown in figure 6, and the data is listed in table 2. Almost all the diffraction peaks belonged to jadeite, and their intensity was consistent with the jadeite standard diffraction pattern provided by the International Centre for Diffraction Data Powder Diffraction File 71-1504 (ICDD PDF, Gates-Rector and Blanton, 2019) (figure 6A). The diffraction peaks were sharp, indicating high crystallinity. In the range of 2θ = 26–33° (figure 6B), there was a weak diffraction peak at d−221 = 2.952Å (2θ = 30.34°), which is the strongest diffraction peak of omphacite (ICDD PDF 71-1068; Gates-Rector and Blanton, 2019), indicating a very small amount of omphacite in the samples. No other mineral diffraction peak was found in the samples. Therefore, the main mineral of the Guatemalan “ice jade” was jadeite.

Raman Spectroscopy. Raman spectra were used to study the phase of inclusions. Transparent jadeite matrix was tested first to separate the superimposed peaks from those of inclusions. The Raman spectra of transparent jadeite matrix and inclusions are shown in figure 7. (For Raman spectra of all 10 samples, see appendix 1.) The Raman shift peaks of jadeite were mainly concentrated in the range of 100–1200 cm–1. The Raman shift peaks at the 1034 and 981 cm–1 bands belong to Si-O stretching vibrations, the peaks at the band 695 cm–1 are caused by Si-O-Si stretching vibrations, the peak at the 522 cm–1 band is related to O-Si-O bending vibrations, and the 490–200 cm–1 band can be assigned to M-O vibrations (Lin et al., 2020). The green spot in the jadeite matrix had Raman shift peaks at 1028, 681, and 190 cm–1, consistent with the characteristic peaks of omphacite (Gendron et al., 2002; Coccato et al., 2014). The obvious Raman shift peaks of the white inclusions at 1097, 814, 760, 504, 476, 288, 183, and 146 cm–1 correspond to the standard Raman peaks of albite (Xue et al., 2020).
BSE Images and Element Mapping. The contrast of BSE images is related to atomic number; elements with higher atomic number are brighter. This method is very suitable for identifying changes in chemical composition in a solid-solution series of minerals. Figures 8 and 9 present the BSE and element mapping images of the Guatemalan “ice jade” samples, which were used to show the chemical changes in jadeite and the distribution of omphacite.
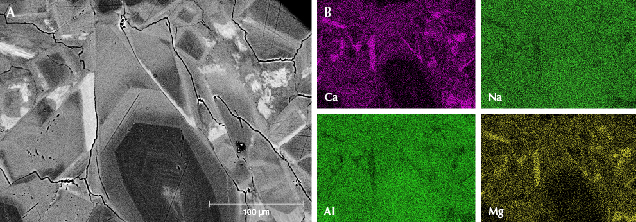
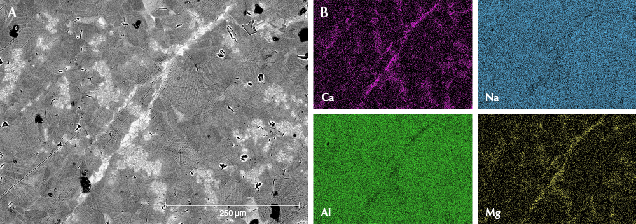
Figure 8 shows jadeite crystals with zoning in sample GB-9. Some of the crystals showed a contrasting dark core (figure 8A), which corresponded to the lowest calcium content (figure 8B). According to the EPMA results, the average calcium oxide content of the darkest area was less than 1.00 wt.%. The brightness of zones increased directly with calcium content. Some of the brightest areas were at the boundaries of the jadeite grains with the highest calcium content shown in the mapping area, which had become the omphacite phase. The chemical compositions of the omphacite phase were further analyzed by EPMA. Figure 9 shows an omphacite vein distributed through the fine-grained jadeite (about 50–100 μm) matrix in sample GB-10. In addition, some microscopic jadeite crystals (about 1–50 μm) with higher calcium content can be seen randomly scattered among the fine-grained jadeite matrix in figure 9A.
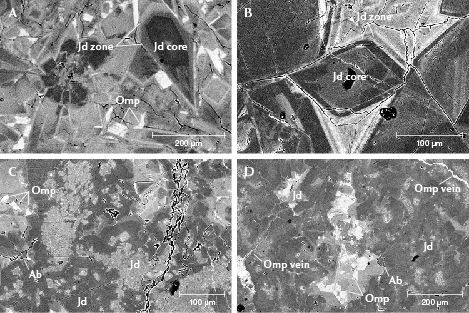
Figure 10 presents more structural characteristics coupled with chemical composition data from BSE images. Figure 10A shows fragmented jadeite crystals of sample GB-9. These crystals had a common core with the same dark contrast and similar zoning, indicating an initially large jadeite grain that cracked into fragments. Figure 10B reveals several intact jadeite grains with darker zones in sample GB-1, indicating the pure sodium and aluminum composition of these grains. Samples GB-5 and GB-4 displayed typical microparticles in the fine texture of “ice jade” (figure 10, C and D). The omphacite and albite grains and the small omphacite veins were occasionally observed scattered in the jadeite matrix.

Chemical Compositions. The compositions of sodium pyroxene and sodium-calcium pyroxene can be classified on a Quad-Jd-Ae diagram, in which “Quad” represents quadrilateral for the calcium-magnesium-iron pyroxene. Jadeite (Jd) and aegirine (Ae) are the most common components of sodium pyroxene. They can form extensive solid solutions with calcium-magnesium-iron pyroxene, leading to sodium-calcium pyroxene (Morimoto, 1989). All of the tested EPMA data are classified on the Quad-Jd-Ae ternary diagram in figure 11. The test points located in the darkest gray area of the jadeite grains on the BSE images are concentrated in the ternary diagram apex of Jd. The test points located in the light gray area of the jadeite grains are plotted on the edge of the jadeite region. A few test points concentrated in the omphacite region were collected from the brightest omphacite grains or veins on BSE images.


The pyroxene grains with different contrast in BSE images are shown in figures 8–10. The chemical composition results are listed in table 3. According to Quad-Jd-Ae diagram classifications suggested by the Commission on New Minerals and Mineral Names (CNMMN) of the International Mineralogical Association (IMA), jadeite belongs to sodium pyroxene, commonly containing more than 80% NaAlSi2O6 (Morimoto, 1989). EPMA results show that the darkest gray areas in the BSE images were nearly “pure” jadeite. The nearly pure jadeite had high contents of aluminum oxide (>21.967 wt.%) and sodium oxide (>13.526 wt.%), and low contents of calcium oxide (<2.583 wt.%) and magnesium oxide (<1.735 wt.%). Calculations revealed that in the sodium-calcium pyroxene series, the jadeite content was more than 90 mol.%, indicating that the first crystallized cores and grains were nearly pure jadeite. In the light gray area of jadeite grains, the contents of sodium oxide (19.635–21.636 wt.%) and aluminum oxide (12.239–13.632 wt.%) were often lower than those of the darkest gray area, while the contents of calcium oxide (4.562–3.052 wt.%) and magnesium oxide (2.056–3.371 wt.%) increased. The content of jadeite is in the range of 80 mol.% to 90 mol.%. Omphacite belongs to sodium-calcium pyroxene. According to the nomenclature of pyroxenes (Morimoto, 1989), the tested spots with no more than 80% jadeite or diopside can be considered omphacite, which were coupled with a very low content of aegirine (<4.2 wt.%). The total impurity cations (Fe3+ + Cr + Fe2+ + Mn + Ti) in the octahedral site were very low. They were in the range of 0.033–2.359 wt.%. The calcium oxide content was higher in the omphacite vein than in the individual omphacite grain.
The chemical compositions of albite were pure. The tested albite contained silicon dioxide (68.55 wt.%, detection limit of 0.86 wt.%), sodium oxide (11.28 wt.%, detection limit of 0.38 wt.%), and aluminum oxide (20.17 wt.%, detection limit of 0.51 wt.%). The other components were not detected by EDS.
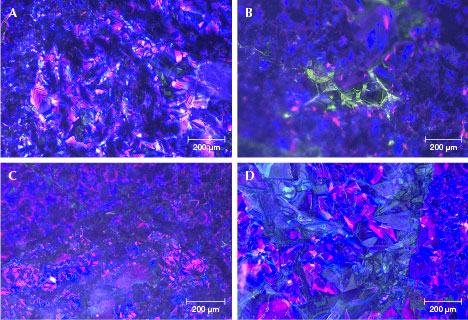
Cathodoluminescence. The color CL images in figure 12 illustrate luminescence color and zoning associated with lattice defects or impurity chemical composition. The samples mainly showed blue-violet and violet-red fluorescence, though a small number of individual grains or parts of grains fluoresced green. The blue-violet and violet-red fluorescence was often more intense than the green fluorescence. The cathodoluminescence color is related to the chemical composition. The colorless and transparent jadeite jade with pure sodium, aluminum, and silicon composition will show blue-violet and violet-red fluorescence. When the jadeite jade contains a certain amount of iron, it will produce green fluorescence (Yuan et al., 2005; Takahashi et al., 2017). The color of our samples’ CL images matched well with the chemical composition study.
The CL images also revealed the growth structure of the “ice jade.” Some coarse jadeite grains (about 100–200 μm) showed prismatic shapes with clear and straight boundaries and had rhythmic zoning (figure 12A), suggesting a regular crystallization cycle of jadeite (Sorensen et al., 2006). The fine-grained jadeite (about 50–100 μm) had irregular shapes and blurred boundaries (figure 12, B and C). Some grains were fragmented (figure 12, C and D), indicating that the jadeites were overstressed or recrystallized (Zhou, 2002).
DISCUSSION
In this study, the “ice jade” from Guatemala was mainly composed of jadeite and included the accessory minerals omphacite and albite. Compared with the previously reported gray-green and blue-green Guatemalan jadeite jade, the Guatemalan “ice jade” is a purer variety. The main mineral component of the gray-green and blue-green Guatemalan jadeite jade is also jadeite, but dark green spotted omphacite and white agglomerated albite are common in their jadeite matrix (Lin et al., 2020; Xue et al., 2020; Zhang and Shi, 2022). In the Guatemalan “ice jade” samples, the omphacite grains were difficult to observe directly with the unaided eye. The albites were clustered as white snowflake-like inclusions or dispersed in the jadeite matrix. Unlike Burmese “ice jade,” Guatemalan material rarely contains fibrous and agglomerate albite (Hu et al., 2003; Liang, 2018).
Compared with the other varieties of Guatemalan jadeite jade, the “ice jade” has lower calcium and magnesium content and higher sodium and aluminum content, and it has a very low omphacite content (Xing et al., 2021). A very small amount of iron and titanium cations was detected in both jadeite and omphacite (FeO = 0.018–2.099 wt.%, TiO2 = 0–0.42 wt.%). Although the amounts of iron and titanium were often higher in omphacite than those in jadeite in the studied samples, they were much lower than those in omphacite in the reported gray-green and blue-green Guatemalan jadeite jade (Xue et al., 2020; Zhang and Shi, 2022). Because of its dispersive fine omphacite and low iron content, the “ice jade” takes on a much lighter green color than the other Guatemalan jadeite jade.
In terms of structural characteristics, Guatemalan “ice jade” showed fine texture and small jadeite grains. The originally larger grains were usually broken into small grains, as shown by microscopy and BSE studies (figures 4D and 10A). The relict intact jadeite grains showed a rhythmic zoning of chemical composition, which was reflected in the cathodoluminescence image. Meanwhile, the small grains often displayed relatively uniform BSE and CL images and higher calcium and magnesium contents in the core. On the other hand, the metasomatism edge and vein composed of omphacite were common in the jadeite matrix. The structural characteristics indicated that the “ice jade” had undergone complex geological processes, not limited to dynamic metamorphism and metasomatic metamorphism (Tsujimori et al., 2005; Sorensen et al., 2006; Brueckner et al., 2009; Shi et al., 2009).
CONCLUSIONS
“Ice jade” from the Morales mine in Guatemala is composed of almost pure jadeite, containing very small amounts of accessory minerals, including omphacite and albite. The omphacite grains were often nearly colorless and not easily observed, while the albite grains were clustered as white snowflake-like inclusions or dispersed as small specks. The “ice jade” exhibited a fine-grained texture, occasionally coexisting with a micro-granular texture. The relatively pure chemical composition of sodium pyroxene accompanied with a fine texture produced a transparent to semitransparent and near-colorless appearance. A small amount of dispersed fine-grained omphacite is considered the cause of the pale green color in Guatemalan “ice jade.”


