Feature Gems & Gemology, Spring 2022, Vol. 58, No. 1

Gem Topaz from the Schneckenstein Crag, Saxony, Germany: Mineralogical Characterization and Luminescence
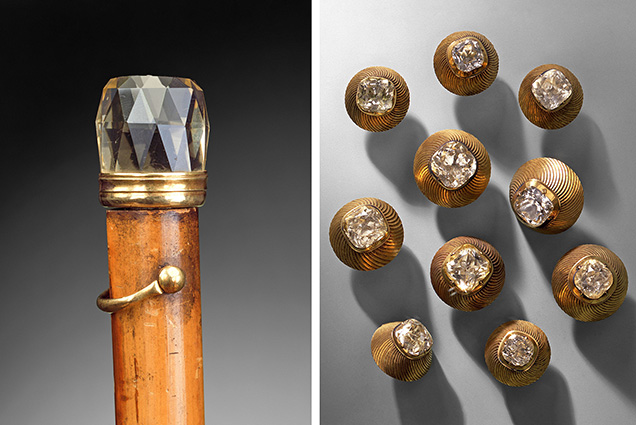

Historical objects containing Schneckenstein topaz
Figure 1. Historical objects containing Schneckenstein topaz, from the former possession of Friedrich August II (Elector of Saxony; and as Augustus III concurrently King of Poland and Grand Duke of Lithuania). All specimens were handcrafted in 1734 by Johann Heinrich Köhler in Dresden and are now in the collection of the Green Vault in Dresden. Left: Rattan walking stick with a 2.3-cm-tall topaz knob (inventory number VIII 253). Right: Selection of five (out of 48) coat buttons (2.1–2.2 cm diameter; inventory number VIII 248) and five (out of 36) cuff links (1.8 cm; inventory number VIII 249), all cushion-cut topaz set in gold. Photos by Jürgen Karpinski; courtesy of the board of the Green Vault in Dresden.

ABSTRACT

Yellow topaz from the Schneckenstein crag in Saxony, Germany, is a famous and historically important gemstone. Surprisingly, mineralogical studies of the material are comparably scarce and have focused mainly on crystal forms and trace element geochemistry. The present study provides a mineral-chemical and spectroscopic characterization of Schneckenstein topaz and its inclusions taking into consideration past and current research results. Particular emphasis lies on the photoluminescence (PL) behavior of the material. Schneckenstein topaz appears inert under common long-wave (~365 nm) and short-wave (~254 nm) UV light sources. In contrast, excitation wavelengths in the 400–440 nm range are much more efficient in exciting pinkish red emission that is assigned to trace levels (10–40 ppm) of Cr3+ incorporated at the six-coordinated Al3+ site.

For more than three centuries, the Schneckenstein crag in western Saxony, Germany, has been a source of gem-quality topaz. Gemstone mining at Schneckenstein had its short zenith in the second quarter of the eighteenth century. Professional exploitation started in 1727, by furrier and draper Christian Kraut of Auerbach, with permission of the impoverished landowner von Trützschler. Only a few months later, Augustus the Strong (1670–1733; as Friedrich August I Elector of Saxony, and as August II King of Poland and Grand Duke of Lithuania) purchased the property from von Trützschler and authorized Kraut to expand mining activities—with the precondition that Kraut would surrender the largest and most beautiful stones to him (Buchner, 1740). From then on, the Schneckenstein workings were called the Königskrone (“Kings Crown”) mine. The finest topaz crystals were extracted during the following decade and a half. A lot of extraordinary quality had been ordered in 1732 by the late Augustus the Strong, but it was his son Friedrich August II (1696–1763; from 1733 Elector of Saxony and as August III concurrently King of Poland and Grand Duke of Lithuania) who commissioned their setting in objets d’art. Several of these items of enormous cultural and historical value are now in the collection of the Green Vault in Dresden (figure 1). Another significant historical piece is a crown containing 485 topaz gemstones from Schneckenstein, which was ordered by George III of Great Britain and Ireland (1738–1820) for his wife Charlotte, on the occasion of their mutual coronation in 1761 (Charpentier, 1778). This crown is presumed to be lost, supposedly disassembled for use for other jewelry (Vollstädt and Lahl, 1997).

Despite several attempts to resume mining in the second half of the eighteenth century, topaz production never again became as profitable as in the early days, and professional mining finally ceased in 1796. However, the decline of the Schneckenstein topaz as a commercial gemstone coincided with increased interest in it as a mineralogical object, both in terms of scientific and collector’s items.

One of the first descriptions of the occurrence was made by counselor of mines, chemist, and mineralogist Johann Friedrich Henckel in 1737 (Henckel, 1737), who was inspector of the Schneckenstein crag in 1739. A more detailed description, which included not only sketches of the crag seen from all four cardinal directions but also sketches of topaz crystals and specimens, was compiled in 1744 by Johann Gott­lieb Kern, who worked until 1741 as an appraiser in Freiberg, Saxony, Germany (published posthumously; cf. Kern, 1776). Another early (and perhaps the first colored) drawing of a Schneckenstein topaz specimen was sketched by the French painter and draftsman François Louis Swebach-Desfontaines, published as plate LIV in Histoire Naturelle – Règne Minéral (Gautier D’Agoty, 1781; see also Wilson, 1995).

Soon thereafter, two publications of historical significance appeared. In his Traité de Minéralogie, the famed mineralogist René Just Haüy (1743–1822), often referred to as the “father of modern crystallography,” illustrated and described in detail crystal forms of Schneckenstein topaz (Haüy, 1801). Results of thorough measurements of these crystals eventually contributed to the elaboration of Haüy’s “law of rational indices.” In 1817, another famous mineralogist, Carl Friedrich Christian Mohs (1773–1839), included the Schneckenstein topaz as a reference material for a hardness of 8 (Mohs, 1822) in what is today known as the Mohs hardness scale (e.g., Deer et al., 2013). In the more recent past, Schneckenstein topaz was studied mainly in terms of its geochemical peculiarities, in particular as a major host for germanium (Schrön, 1968; Seim and Schweder, 1969; Breiter et al., 2013b).

Since 1938 the Schneckenstein crag has had the status of a natural monument. The area is fenced, and collecting and especially digging is strictly prohibited. Nevertheless, small topaz crystals of fairly good quality can still be found in the weathering debris. For additional historical information concerning Schneckenstein topaz, the reader is referred to the comprehensive descriptions of Vollstädt and Lahl (1997), Leithner (2008), and Lahl (2012).

GEOLOGICAL BACKGROUND

The Schneckenstein crag is located on the western slope of Kiel Mountain, about 10 km southeast of the town of Falkenstein/Vogtland (figure 2, left). Its formation is related to the Eibenstock tourmaline granite (part of the Nejdek-Eibenstock massif; Breiter, 2012), whose emplacement was about 319.8 ± 1.0 Ma (million years ago) (Ticho­mirowa and Leonhardt, 2010). The Schneckenstein crag is situated about 400 m away from the granite body, within its contact aureole (Förster et al., 1999; see again figure 2, left). During granite intrusion, several diatremes formed. These were filled with quartz porphyries or breccia that underwent pneumatolytic overprinting “greisenization” (Baumann and Gorny, 1964). The Schneckenstein crag represents the top of a breccious vent filling that resisted weathering (figure 2, right). Greisenization is assigned to a two-stage process: (1) tourmaline formation due to boron infiltration and (2) topaz formation—that included partial tourmaline replacement—from fluorine-rich solutions. The breccia consists of fist-sized fragments of a quartzite-schist-like rock cemented by topaz and quartz crystals. With increasing depth, the tourmaline content increases at the expense of topaz (Schröder, 1915; Baumann and Gorny, 1964). This is known because a lower level of the Schneckenstein breccia was drilled from a mining tunnel of the nearby Grube Tannenberg tin mine. Gem-quality topaz crystals worth cutting were mostly found in cavities and druses in the uppermost regions of the crag.

Location and cross-section of the Schneckenstein crag
Figure 2. Left: Location of the Schneckenstein crag (marked by a solid red circle in the inset map) in the western contact aureole of the Eibenstock granite (modified after Jäschke and Unger, 2007, and Sebastian, 2013). Right: Cross-sectional profile of the Schneckenstein breccia (simplified after Baumann and Gorny, 1964).

Topaz originates predominantly from granitic pegmatites (as in Brazil, the Ural Mountains, and Namibia) or from vapor cavities in rhyolite lava flows (as at the Thomas Range in the state of Utah and the Chivinar volcano in Argentina). By contrast, hydrothermal topaz formation in a late greisenization stage is decidedly rare. To the best of our knowledge, only one genetic analogue of the Schneckenstein topaz exists worldwide, namely the topaz occurrence in the tin-bearing quartz porphyry of Mount Bischoff, Tasmania (Twelvetrees and Petterd, 1897; Wright and Kwak, 1989).

MATERIALS AND METHODS

Thirteen topaz crystals (0.47–3.86 g) were selected for the present study (figure 3). Seven of them were collected at the Schneckenstein crag during a field trip in 2014, three were provided from the museum collection of the Vogtländisch-Böhmisches Mineralienzentrum Schneckenstein, and three are from the mineral collection of the Institut für Mineralogie und Kristallographie (University of Vienna). Three of the specimens were embedded in araldite epoxy, ground, and polished for Raman spectroscopic and chemical analyses. After completion of Raman spectroscopy and trace element analysis, the mount was coated with carbon for electron probe microanalysis (EPMA). Two raw (i.e., unprepared) crystals that were particularly clear and virtually free of inclusions were used for photoluminescence (PL; including excitation-emission) spectroscopy. These two specimens were then placed in a platinum crucible subjected to dry annealing in air (at 550°C for 48 h), and PL analyses were repeated.
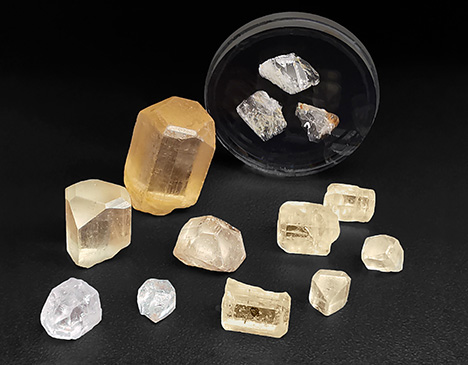
Topaz sample material from this study
Figure 3. Topaz sample material investigated in the present study (height of the tallest crystal is 18 mm). The two colorless samples (lower left) were initially yellow and became bleached upon heat treatment at 550°C for 48 h. The one-inch sample mount in the background contains three doubly polished crystals embedded in epoxy; it was subjected to spectroscopy, EPMA, and LA-ICP-MS analysis. Photo by Manuela Zeug.

Mass densities were determined by weighing samples in air and in distilled water (a drop of liquid detergent was added to reduce surface tension). Refraction measurements were done using a Krüss ER601-LED refractometer equipped with a diode lamp emitting 589 nm light.

Major-element analyses were performed on a JEOL JXA-8530FPlus HyperProbe EPMA system operated at 15 kV and 10 nA. Counting times were 10 s for major and 30 s for minor elements. A topaz reference crystal was used for calibrating major elements (F-Kα, Si-Kα, and Al-Kα). For calibrating the instrument for minor elements, reference materials included diopside NMNH117733 (Mg-Kα and Ca-Kα), microcline NMNH143966 (K-Kα), albite (Na-Kα), garnet (Fe-Kα), ilmenite NMNH96189 (Ti-Kα), rhodonite (Mn-Kα), and tugtupite (Cl-Kα). The three NMNH reference materials are Smithsonian microbeam standards (Jarosewich, 2002; and references therein) and all others are in-house reference materials. Detection limits were determined according to Toya and Kato (1983) as the threefold background noise. Further EPMA details are described in Nasdala et al. (2021).

Trace element analysis was done by means of laser ablation–inductively coupled plasma–mass spectrometry (LA-ICP-MS) using an Agilent 7500cx quadrupole ICP-MS unit coupled with an ESI NWR193 laser ablation system. A 193 nm laser operated with 8 Hz repetition frequency was used, resulting in ~6.5 mJ/cm2 energy density at the sample surface. The spot size was set to 75 μm and the dwell time was 20 ms per element. A gas blank was acquired for 25 s prior to 50 s of ablation time. The ablated material was transported with He (gas flow rate 0.75 L/min) to the spectrometer unit. NIST standard glasses SRM610 and SRM612 (Jochum et al., 2011) were used for external calibration, and Si was measured as the internal standard. SRM612 was used for data reduction of all elements. USGS reference glass BCR-2G (Jochum et al., 2016) served for monitoring possible beam drift and was reproduced within 10% relative error. GLITTER 4.0 software (Griffin et al., 2008) was used for data reduction. For more analytical details, see Kruzslicz et al. (2020).

Raman spectra were obtained at room temperature using a dispersive Horiba LabRAM HR Evolution system equipped with an Olympus BX-series optical microscope and a Peltier-cooled, Si-based charge-coupled device detector. Spectra were excited with the 473 nm emission of a diode-pumped solid-state laser (8 mW at the sample surface). A 100× objective (numerical aperture 0.90) was used. The scattered light was dispersed with an 1800 grooves/mm diffraction grating, resulting in spectral resolution of 1.2 cm–1. Further experimental details are described elsewhere (Zeug et al., 2018).

Photoluminescence emission spectra, excitation spectra, and excitation-emission matrices were obtained from a crystal that was virtually free of major inclusions by means of a Horiba Fluorolog-3 system equipped with double-grating excitation and emission monochromator (gratings with 1200 grooves/mm) and R928P photomultiplier detector. Xe-lamp excitation (450 W) was used, and excitation correction was performed using an internal reference photodiode. Spectra and maps were obtained with an activated dark offset, resulting in noise reduction. With this system, excitation source, and settings, emission can be reliably obtained in the wavelength range 250–850 nm. Bandpass for excitation spectra of the 683 nm emission band was set to 1 nm. Excitation spectra were obtained in the wavelength range of 250–700 nm with a step width of 0.5 nm. Emission spectra (bandpass 1 nm and step size 0.2 nm) were excited with 407 nm excitation wavelength and obtained in the wavelength range 555–800 nm. For the excitation-emission map, step size and bandpass were set to 2 nm for excitation and 1 nm for emission, respectively.

RESULTS AND DISCUSSION

General Properties. All samples studied here showed different shades of pale yellow, which is the most typical color of Schneckenstein topaz. This color is rather low-grade for gemological uses; it is commonly referred to as “wine yellow” (figure 4). After annealing, samples were “bleached” and became nearly colorless. All samples were transparent and appeared inert under short-wave and long-wave UV lamps. The crystals had a short prismatic habit with well-developed terminations. Most of them contained diverse gaseous, liquid, and/or solid inclusions, with sizes of up to several hundred micrometers. SG values averaged 3.52 ± 0.01, and the RI was 1.607–1.616.
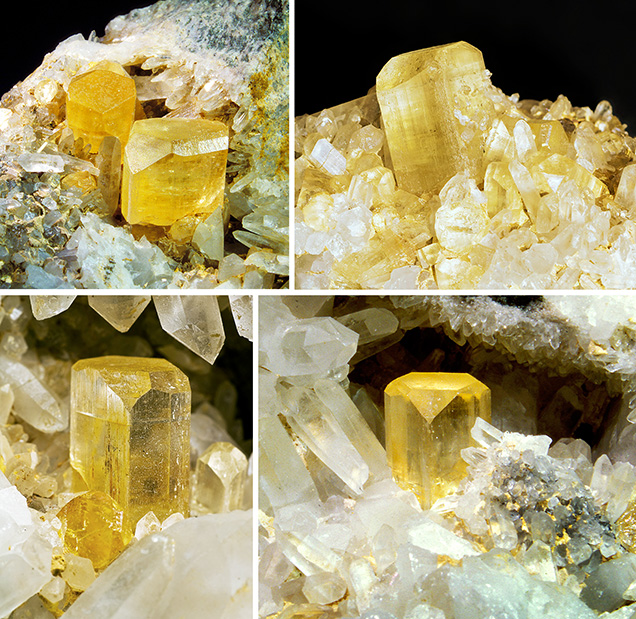
Four specimens of vivid “wine yellow” topaz with quartz from the Schneckenstein crag.
Figure 4. Four specimens of vivid “wine yellow” topaz with quartz from the Schneckenstein crag. Top left: The largest topaz crystal is 18 mm tall. Top right: The crystal in the center is 17 mm tall. Bottom: Both large crystals are 14 mm tall. The top right specimen is from the private collection of L. Nasdala; the other three specimens are in the mineral collection of TU Bergakademie Freiberg (inventory numbers MiSa56852, MiSa59082, and MiSa57016, respectively). Photos by Andreas Massanek (top left and bottom right), Manfred Wildner (top right), and Jeff Scovil (bottom left).

Chemical Composition. The chemical composition of Schneckenstein topaz is summarized in table 1. The samples had generally low levels of non-formula constituents. The calculated chemical formula is Al1.99Si1.01O4.00[F0.84(OH)0.16]2. Note that the F content measured here (17.4 ± 0.5 wt.%) is higher than the values of 14.4–14.5 wt.% reported by Bauer (1902) and lower than the value of 19.5 ± 0.6 wt.% reported by Ribbe and Rosenberg (1971), but it coincides well with the results of Breiter et al. (2013b; 17.9–18.5 wt.%, or ~1.75 apfu). Based on the inverse correlation of OH/F ratio and formation temperature (Barton, 1982), the lower F content compared with pneumatolytic columnar topaz from the Erzgebirge (“pycnite” with F >1.8 apfu) points to late-stage formation, presumably under hydrothermal conditions (Breiter et al., 2013b).

Ge concentrations of 40–70 ppm and Ga concentrations of 2–3 ppm determined herein correspond reasonably well with results of previous studies (~69 ppm Ge by Goldschmidt and Peters, 1933; 50–86 ppm Ge by Seim and Schweder, 1969; 42–116 ppm Ge and 2–4 ppm Ga by Breiter et al., 2013b). Comparably high Ge but low Ga values again support low-temperature topaz formation: Greisenization leads to Ge enrichment due to the uptake in newly formed hydrothermal topaz, while Ga is dissipated by hydrothermal fluids (Breiter et al., 2013a). 

Raman Spectroscopy. The Raman spectrum of Schneckenstein topaz (figure 5) shows the typical fingerprint pattern of this mineral’s Raman-active vibrations (for band assignment, see Beny and Piriou, 1987). The OH stretching range is dominated by a clearly asymmetric band. This asymmetric band shape is due to an unresolved splitting of two bands, with a band at ~3650 cm–1 that corresponds mainly to “OHB” of Pinheiro et al. (2002), and a low-intensity shoulder near ~3640 cm–1 that is assigned to “OHA.” Such an OH band pattern, along with the generally low OH band intensity, points to topaz with high F/OH ratio, with a fraction of OH at the (F,OH) site of about 15 mol.% (Pinheiro et al., 2002). The latter corresponds well with our chemical data (table 1).

Raman spectrum of a Schneckenstein topaz
Figure 5. Raman spectrum of a topaz from Schneckenstein (second crystal from the left in figure 3, random sample orientation). The intensity of the hydroxyl-stretching region (between 3500 and 3800 cm–1) has been increased four times for better recognizability.
Table 1. Mean chemical composition of Schneckenstein topaz.

Raman analyses of inclusions (often showing two or more phase assemblages; figure 6) yielded a range of phases, including gaseous CO2, liquid H2O, rutile, apatite, a xenotime-group mineral, clinochlore, and quartz. Fluid inclusions may be described as multiphase, vapor-rich two-phase or three-phase inclusions. We were unable to identify small opaque inclusions that probably consisted of one or more ore mineral(s). Colorless cubic-shaped crystals did not yield any Raman band pattern; it appears reasonable to assume they are halite.

Inclusions in Schneckenstein topaz
Figure 6. Plane-polarized transmitted-light photomicrographs showing the diversity of single- and multiphase inclusions in Schneckenstein topaz (bottom center crystal in figure 3). V—vapor (predominantly CO2). L—liquid (predominantly H2O). The occurrence of halite (colorless cubic-shaped crystals) is assumed but could not be confirmed, because crystals did not yield any Raman spectra. Abbreviations of names of minerals and mineral groups according to Whitney and Evans (2010): Ap—apatite; Clc—clinochlore; Hl—halite; Qz—quartz; Rt—rutile; Xtm—xenotime; Zrn—zircon. Photomicrographs by Manuela Zeug.

Photoluminescence Spectroscopy. Results of PL spectroscopic analyses are presented in figure 7. A reasoning for why such data should preferably be plotted on an energy-equivalent scale such as the wavenumber, instead of on a wavelength scale (as is commonplace in gemological papers), is provided in box A, along with some additional remarks on luminescence terminology.
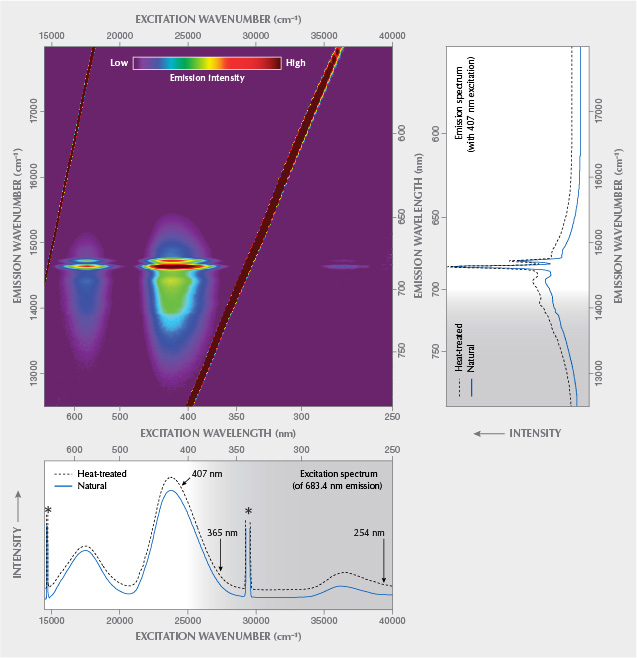
Emission and excitation plots for Schneckenstein topaz
Figure 7. Top left: Color-coded excitation-emission matrix (visualizing the emission intensity at variable wavenumber/wavelength upon excitation with light of variable quantum energy, consisting of a total of 56,250 individual data points) for topaz from Schneckenstein. The matrix is presented along with selected emission spectra (emission intensity under 407 nm excitation obtained at variable wavelength; top right) and excitation spectra (intensity of the ~14632 cm–1 [~683.4 nm] emission under variable excitation; bottom). In the emission and excitation plots, spectra of a natural topaz specimen and its heat-treated analogue (bottom left crystal in figure 3) are shown. Spectral ranges that are not visible to the human eye are underlain in gray. Diagonal dark red lines in the main emission-excitation matrix, and corresponding narrow lines in the excitation spectra (here marked by asterisks), are analytical artifacts (emission = excitation, and emission = ½ × excitation energy). Note that the 407 nm laser used herein is much more efficient for exciting Cr3+ emission than common UV lamp sources (spectral positions marked with arrows in the bottom plot). Emission and excitation spectra of the annealed sample are shown with vertical offset for clarity.

BOX A: LUMINESCENCE—NOMENCLATURE AND SPECTRAL VISUALIZATION

Luminescence describes the general ability of minerals and other matter to emit UV, visible and/or IR light after valence electrons have experienced energetic excitation. If emission occurs upon spontaneous energy release from the excited state, the process is named according to the initial energetic excitation (such as photoluminescence after excitation by photons of electromagnetic radiation, chemoluminescence for emissions whose energy originated from a chemical reaction, or cathodoluminescence after excitation by electrons). In contrast, non-spontaneous release of excited electrons from so-called electron traps requires energetic stimulation (in addition to the initial energetic excitation); here the emission process is named according to the type of stimulation (such as optically stimulated luminescence).

It should be noted that there is general confusion of terms in the published literature. Excitation and stimulation are often used interchangeably, and even more often fluorescence is used when luminescence is meant. Fluorescence and phosphorescence are two terms that relate to different delay-time regimes caused by different types of electronic transitions. Fluorescence describes emission upon quick spontaneous decay of the energetically excited state, typically within less than 10 microseconds, due to spin-allowed electronic transitions. By contrast, phosphorescence is emission based on comparably slow spontaneous decay of the energetically excited state (between tens of microseconds and several hours), related to spin-forbidden electronic transitions. The subdivision into fluorescence and phosphorescence is applied mostly to photoluminescence. A non-PL example is the “glow” of white phosphorous, a permanently refreshed fluorescence-type chemoluminescence.

Emissions of ions of transition metals arise mostly from slow, spin-forbidden electronic transitions, and hence their common description as “fluorescence” is misleading. One of the most prominent examples is the Cr3+-related emission of ruby (lifetime of the excited state is several milliseconds), which actually belongs to phosphorescence (Jones et al., 2020) but has mostly—and not quite correctly—been described as fluorescence (e.g., Brown, 1964; Tsai and D’Haenens-Johansson, 2021). The bottom line is that if the exact type of electronic transition causing the observed emission is unknown, or if an emission consists of several different components, the use of the general term luminescence is preferred.

Another issue, especially in the gemological literature, is how to visualize spectra whose signals are based on electronic transitions (this applies not only to luminescence but also to optical absorption). Most individual spectral signals that relate to electronic transitions are symmetric in energy. For this reason, spectra—especially in cases when data evaluation is intended—need to be plotted on a scale that is proportional to the quantum energy of the detected light, such as the wavenumber (in units of cm–1). By contrast, wavelength (i.e., the inverse of the wavenumber) is a physical parameter that is not proportional to photon energy. Spectra that are plotted on the usual wavelength scale are therefore distorted—that is, compressed in their high-energy region (blue to UV) and stretched in their low-energy (red and near-infrared) region (see figure A-1). Consequently, fitting spectra that are plotted on the wavelength scale with the assumption of symmetric (Gaussian and/or Lorentzian) band shapes must yield biased fit results. For this reason, excitation and emission shown in figures 7 and B-1 are plotted on the wavenumber scale. However, we are well aware of the general preference for wavelengths in the gemological community, and we also provide the (not evenly spaced) wavelength scale on a second abscissa axis for convenience.

Spectrum with signals based on electronic transitions
Figure A-1. A spectrum consisting of two perfectly symmetric bands of the same energy width (left) is significantly distorted when plotted on the wavelength scale (right).

The emission spectrum (figure 7, top right) is dominated by a narrow doublet in the red range, at ~14632 and ~14720 cm–1 (~683.4 and ~679.4 nm, respectively), assigned to the split, spin-forbidden d–d transition 2E→4A2 of trace Cr3+ (commonly referred to as R1 and R2 lines). This doublet is superimposed on a broad emission feature in the 12500–15500 cm–1 (approximately 800–645 nm) range, which is due to the spin-allowed 4T24A2 transition of Cr3+ (Tarashchan et al., 2006). The broad band is modulated by lower-intensity bands at ~14080 cm–1 (~710 nm) and ~14400 cm–1 (~694 nm) whose assignment remains an open question. They have been interpreted as emissions of pairs and clusters of Cr3+ ions (Gaft et al., 2003) and phonon satellites (Tarashchan et al., 2006), respectively. The spectral positions of the two R lines correspond to Cr3+ in a fully fluorinated environment—that is, a (CrO4F2)7– site (O’Bannon and Williams, 2019)—which supports again the above interpretation of the sample as topaz with a low OH/F ratio. The emission spectrum remained virtually unchanged after sample annealing (figure 7). Differences with emission patterns of other Cr3+-bearing gem minerals are explained by different crystal-field effects (that is, distortion of electronic levels in a non-isotropic environment). For a more detailed discussion, see box B.

BOX B: LUMINESCENCE RELATED TO TRIVALENT CHROMIUM

Several gem minerals incorporate minor amounts of Cr3+ at a lattice site that is six-coordinated to O2– (and possibly other anions). Examples include corundum, beryl, chrysoberyl, diopside, garnet, tourmaline, and topaz. However, absorption (i.e., coloration) and emission related to Cr3+ may vary appreciably (see also figure 8 in Tsai and D’Haenens-Johansson, 2021). This is because of so-called crystal-field effects: The six-coordinate octahedral Cr3+ site is variably distorted from its ideal octahedral symmetry, due to various arrangements of neighboring atoms, depending on the respective host mineral’s crystal structure.

In contrast to optical absorption processes, only the two lowest-energy excited levels of six-coordinate octahedral Cr3+ (i.e., the narrow, split 2E level and the broad, thermally populated 4T2 level) are significant for the emission of light. In different host minerals, these levels have unequal energy differences relative to one another and relative to the electronic ground state (4A2), finally resulting in different emission characteristics. This is visualized (greatly simplified) in figure B-1.

Room-temperature emission spectra of common gem minerals
Figure B-1. Room-temperature emission spectra related to Cr3+ in three common gem minerals, along with greatly simplified sketches of the lowest electronic levels. Rather minor variations in energy differences among corresponding electronic levels result in apparently different PL patterns: In ruby, electrons are transferred non-radiatively from the 4T2 to the split 2E level (wavy black arrow), and the energy is released radiatively (that is, under emission of PL) only upon 2E → 4A2 transition (red arrows). In the other two minerals, increasing portions of electrons undergo a radiative 4T24A2 transition and correspondingly fewer electrons are transferred to the 2E level (visualized by varying thicknesses of lines).

For Cr3+ in corundum, the energy difference ΔE between 2E and 4T2 is comparably large. The two levels hence do not “overlap” at room temperature, and direct 4T24A2 relaxation does not occur, but excited electrons undergo a so-called fast intersystem crossing (ISC) from the 4T2 singlet to the energetically favorable 2E triplet-excited state (Kisliuk and Moore, 1967). Emission of chromium-bearing corundum is therefore dominated by the two narrow R lines (spin-forbidden 2E → 4A2 transition). In contrast, ΔE is much smaller for Cr3+ in beryl, resulting in energetic preference and hence significant contribution of the spin-allowed 4T24A2 relaxation at room temperature (Kisliuk and Moore, 1967). The latter is detected as an intense broad band underlying the two R lines (figure B-1). Chromium-bearing topaz has intermediate ΔE and therefore practically represents an intermediate state between the two former minerals. Here, 4T2 and 2E states are in virtual thermal equilibrium at room temperature (Gaft et al., 2003; Tarashchan et al., 2006). The Cr3+-related emission of topaz therefore consists of nearly equal contributions of the two narrow R lines (and their vibrational satellites) related to the spin-forbidden 2E → 4A2 transition, and a broad band related to the spin-allowed 4T24A2 transition (Gaft et al., 2003; Tarash­chan et al., 2006; O’Bannon and Williams, 2019).

The Schneckenstein topaz is certainly not unique but perhaps somewhat special, because this material does not show noticeable Cr3+-related absorption but fairly intense Cr3+-related emission. The majority of other pale gem topaz (originating from Namibia, Pakistan, and the Ural Mountains) that we tested did not show any luminescence. The PL characteristics of “Imperial” topaz with its much higher, coloration-affecting Cr3+ content—on the order of hundreds of ppm (Taran et al., 2003; Schott et al., 2003; Krzemnicki, 2017; Gauzzi et al., 2018)—is widely similar to that of the Schneckenstein topaz. High emission intensity of the Schneckenstein material in spite of its low Cr3+ content may in part be assigned to particularly low concentrations of luminescence “quenchers,” such as Fe2+.

Excitation Spectroscopy. The excitation spectrum (figure 7, bottom), obtained for the most intense PL signal at ~683.4 nm, shows two main broad signals in the ranges 16000–18800 and 22400–25800 cm–1 (approximately 625–530 and 445–390 nm). The spectrum is widely similar to that of a light violet topaz (300 ppm Cr) from Ouro Preto, Brazil, presented by Tarashchan et al. (2006). Already Hoover and Theisen (1993) had studied the excitation of Cr3+-related emission of pink topaz; however, these authors did not present any excitation spectra but merely mentioned its wide similarity to that of ruby, emerald, red spinel, and green jade. The two broad bands correspond to the main electronic absorption levels and are assigned to intense PL following Cr3+-related electronic excitation (4A24T2 and 4A24T1 transitions, respectively). For detailed discussions of the energy difference (“Stokes shift”) between 4A24T2 absorption and 4T24A2 emission, see for instance Kisliuk and Moore (1967) and Marfunin (1979).

The excitation spectrum is similar but not identical to absorption patterns of “Imperial” topaz (Petrov et al., 1977; Schott et al., 2003; Krzemnicki, 2017; Smith, 2020). The difference between absorption and excitation spectra is because a certain fraction of the absorption in natural, untreated topaz is due to defect-related color centers (Petrov, 1977, 1978). Note that annealing of such color centers causes significant color change after thermal treatment (Schott et al., 2003; Greenidge, 2018). The latter is especially true for the yellow Schneckenstein topaz that, after dry heating in air at 550°C for 48 h, was found to turn near-colorless (while retaining the Cr3+-related PL).

The excitation spectrum indicates that common gemological UV lamps with ~365 nm and ~254 nm excitation wavelengths are decidedly inefficient sources to induce Cr3+-related emission from topaz. In contrast, PL is readily excited by illumination by either orange to greenish yellow or by blue to violet light. For instance, a 407 nm laser (see again figure 7, bottom) or a 390 nm LED lamp emit light that is effectively absorbed by Cr3+-bearing topaz and thus excite pink to red luminescence with relative ease, whereas a 385 nm LED was found to be less efficient.

The excitation characteristics of other Cr3+-bearing gem minerals may be similar but not necessarily identical to that of topaz. This is due to their different crystal-field strengths that, among others, control the energetic difference of 4T2 and 2E levels (figure 8; see also box B).

Excitation spectrum of Schneckenstein topaz
Figure 8. Excitation spectrum of Schneckenstein topaz (obtained from the bottom left crystal in figure 3 before annealing), visualizing the intensity of the Cr3+-related emission at 14632 cm–1/683.4 nm depending on the excitation energy. The spectra of ruby (14403 cm–1/694.3 nm) and emerald (14620 cm–1/684 nm) are shown for comparison. Spectra are shown with vertical offset for clarity. Breaks in the excitation spectra (marked by asterisks) are analytical artifacts (emission = excitation, and emission = ½ × excitation energy). Note the shift of the two main absorption bands among the three minerals. For band assignment, see Tarashchan et al. (2006).

Excitation-Emission Spectroscopy. The excitation-emission matrix of Schneckenstein topaz shown in figure 7 is the color-coded visualization of quantum energy and intensity of the emission with respect to the quantum energy of the excitation. Such a matrix is generated by measuring the emission intensity at variable spectral positions (potentially comprising the long-wave UV, visible, and NIR ranges) and at different excitation energies. Note that such plots have also been described as three-dimensional luminescence spectra (with excitation energy, emission energy, and intensity as the three dimensions) or as excitation-emission maps. We prefer not to use the latter term, to avoid possible confusion with hyperspectral maps where multiple point analyses are conducted at different x and y coordinates, whereas a matrix consists of multiple analyses obtained at the very same sample location. For the principle of the technique, the reader is referred to the fundamental description in Marfunin (1979); more specific elucidations are given in box B of Zhang et al. (2020).

The emission intensity of the Schneckenstein topaz varies strongly with the excitation energy, whereas the principal spectral pattern of the emission does not. Note that the coloration distribution in the excitation-emission matrix does not show significant diagonal features (for a contrasting example, see figure 4G of Zhang et al., 2020). This indicates that the emission does not consist of several components with different excitation characteristics. Rather, the emission is assigned solely to Cr3+ substituting for Al3+ (Gaft et al., 2003; Tarashchan et al., 2006; O’Bannon and Williams, 2019).

CONCLUSIONS

The present article provides a comprehensive summary of past and present mineral-chemical and spectroscopic investigations of the historical Schneckenstein topaz, with emphasis on luminescence studied by excitation-emission spectroscopy. It is, to the best of our knowledge, only the third excitation-spectroscopy study of topaz, and the first that was conducted on non-“Imperial” topaz. The Schneckenstein material is characterized by remarkably low contents of non-formula elements and a high F/OH ratio. The latter is also reflected in the Raman spectra by the OH-band pattern with its comparable low intensity. The PL spectra reveal the typical Cr3+-luminescence pattern in topaz, and no additional luminescence bands are present. The determined values for Ge (40–70 ppm) and Ga (2–3 ppm) are mainly consistent with results from previous studies (Goldschmidt and Peters, 1933; Schrön, 1968; Seim and Schweder, 1969) and coincide with an assumed topaz formation in a late hydrothermal state following pneumatolytic greisenization (Breiter, 2013a). To the best of our knowledge, this is the first study that provides microscopic images of, and analytical data for, the manifold inclusions in Schneckenstein topaz. Inclusions identified by means of Raman spectroscopy were apatite, rutile, quartz, zircon, and a xenotime-group mineral. The assumed assignment of cubic crystals in multiphase inclusions as halite will require further study.

The excitation-emission spectroscopy technique is a rather recent advancement of excitation spectroscopy, which is becoming more important in the analysis of gemstones. Successful applications of excitation-emission spectroscopy include studies of Cr3+-colored gem minerals (Hoover and Theisen, 1993); amber (Bellani et al., 2005; Jiang et al., 2020; Zhang et al., 2020); opal (Fritsch et al., 2015); and dia­mond (Luo and Breeding, 2013). In the present case, excitation-emission spectroscopy provides simple reasoning for the apparent luminescence inertness of yellow topaz observed under UV illumination. Excitation energies of Cr3+ electronic levels in topaz do not coincide with quantum energies of light that is emitted by short-wave and long-wave UV lamps used in conventional gem testing. By contrast, short-wavelength visible (i.e., violet) light is remarkably efficient in exciting readily visible pinkish PL (figure 9) that is caused by Cr3+ concentrations as low as ~25 ppm.
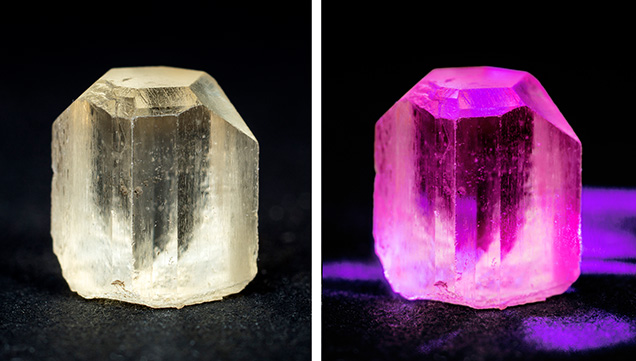
Luminescence of a Schneckenstein topaz crystal
Figure 9. Two photos of the second crystal from the left in figure 3 (1.6 g, 9.5 mm tall). Left: White-light photo showing the common pale yellow bodycolor. Right: The crystal emits pink to red luminescence under 407 nm illumination. Photos by Manfred Wildner.

Dr. Manuela Zeug and Dr. Chutimun Chanmuang N. are researchers, and Prof. Dr. Lutz Nasdala is chairholder for Mineralogy and Spectroscopy, at the Institut für Mineralogie und Kristallographie, University of Vienna. Prof. Dr. Christoph Hauzenberger is chairholder for Petrology and Geochemistry at the Institute of Earth Sciences - NAWI Graz Geozentrum in Graz, Austria.

Three of the topaz crystals investigated were kindly made available by Steffen Gerisch, and sample preparation was done by Andreas Wagner. Gerald Giester, Michael Loitzenbauer, and Roland Seitz are thanked for experimental help. Alexander Repstock and Wolfgang Zirbs assisted in acquiring literature. Michael Gaft is thanked for helpful discussions. We are indebted to Dirk Weber for providing images of historical objects, and the board of the Green Vault in Dresden for permission to use the images herein. Andreas Massanek, Jeff Scovil, and Manfred Wildner are thanked for photographs of topaz specimens. Constructive comments and suggestions of three anonymous reviewers are gratefully acknowledged.

Barton M.D. (1982) The thermodynamic properties of topaz solid solution and some petrologic applications. American Mineralogist, Vol. 67, pp. 956–974.

Bauer M. (1902) Hermann Albert Weber: Ueber die Aufschliessung der Silikate durch Borsäureanhydrid und über eine neue Methode zur Bestimmung des Fluors im Kryolith. Review of inaugural dissertation (Heidelberg 1900, 38 pp.). Centralblatt für Mineralogie, Geologie und Paläontologie, pp. 504–507.

Baumann L., Gorny S. (1964) Neue tektonische und petrographische Untersuchungsergebnisse in der Zinnerzlagerstätte Tannenberg-Mühlleiten. Freiberger Forschungshhefte C, Vol. 181, pp. 89–118.

Bellani V., Giulotto E., Linati L., Sacchi D. (2005) Origin of the blue fluorescence in Dominican amber. Journal of Applied Physics, Vol. 97, No. 1, article no. 016101, http://dx.doi.org/10.1063/1.1829395

Beny J.M., Piriou B. (1987) Vibrational spectra of single-crystal topaz. Physics and Chemistry of Minerals, Vol. 15, No. 2, pp. 148–154, http://dx.doi.org/10.1007/BF00308777

Breiter K. (2012) Nearly contemporaneous evolution of the A- and S-type fractionated granites in the Krušné hory/Erzgebirge Mts., Central Europe. Lithos, Vol. 151, pp. 105–121, http://dx.doi.org/10.1016/j.lithos.2011.09.022

Breiter K., Gardenová N., Kanický V., Vaculoviĉ T. (2013a) Gallium and germanium geochemistry during magmatic fractionation and post-magmatic alteration in different types of granitoids: A case study from the Bohemian Massif (Czech Republic). Geologica Carpathica, Vol. 64, No. 3, pp. 171–180, http://dx.doi.org/10.2478/geoca-2013-0018

Breiter K., Gardenová N., Vaculoviĉ T., Kanický V. (2013b) Topaz as an important host for Ge in granites and greisens. Mineralogical Magazine, Vol. 77, No. 4, pp. 403–417, http://dx.doi.org/10.1180/minmag.2013.077.4.01

Brown G.C. Jr. (1964) Fluorescence lifetimes of ruby. Journal of Applied Physics, Vol. 35, pp. 3062–3063, http://dx.doi.org/10.1063/1.1713175

Buchner J.G. (1740) Lapidibus pretiosis in Voigtlandia reperiendis. Acta Physico-Medica Academiae Caesareae Leopoldino-Carolinae Naturae Curiosorum Exhibentia, Vol. 5, pp. 101–105.

Charpentier J.F.W. (1778) Mineralogische Geographie der Chursächsischen Lande. Siegfried Leberecht Crusius, Leipzig.

Deer W.A., Howie R.A., Zussman J. (2013) An Introduction to the Rock-Forming Minerals, 3rd ed. Berforts Information Press, Stevenage, UK, 510 pp.

Förster H.-J., Tischendorf G., Trumbull R.B., Gottesmann B. (1999) Late-collisional granites in the Variscan Erzgebirge, Germany. Journal of Petrology, Vol. 40, No. 11, pp. 1613–1645, http://dx.doi.org/10.1093/petroj/40.11.1613

Fritsch E., Megaw P.K.M., Spano T.L., Chauviré B., Rondeau B., Gray M., Hainschwang T., Renfro N. (2015) Green-luminescing hyalite opal from Zacatecas, Mexico. Journal of Gemmology, Vol. 34, No. 6, pp. 490–508.

Gaft M., Nagli L., Reisfeld R., Panczer G., Brestel M. (2003) Time-resolved luminescence of Cr3+ in topaz Al2SiO4(OH,F)2. Journal of Luminescence, Vol. 102–103, pp. 349–356, http://dx.doi.org/10.1016/S0022-2313(02)00532-X

Gautier D’Agoty F. (1781) Histoire naturelle ou exposition générale de toutes ses parties, gravées et imprimées en couleurs naturelles. 1. Règne minéral. Paris (self-published).

Gauzzi T., Graça L.M., Lagoeiro L., Mendes I.C., Queiroga G.N. (2018) The fingerprint of imperial topaz from Ouro Preto region (Minas Gerais state, Brazil) based on cathodoluminescence properties and chemical composition. Mineralogical Magazine, Vol. 82, No. 4, pp. 943–960, http://dx.doi.org/10.1180/minmag.2017.081.078

Goldschmidt V.M., Peters C. (1933) Zur Geochemie des Germaniums. Nachrichten von der Gesellschaft der Wissenschaften zu Göttingen. Mathematisch-Physikalische Klasse, Fachgruppe IV, Vol. 33, pp. 141–166.

Greenidge D. (2018) Investigations of color center phenomena in topaz and quartz through electron spin resonance with reference to optical absorption and nuclear magnetic resonance: Implications for extended mineral applications. Malaysian Journal of Fundamental and Applied Sciences, pp. 142–149, http://dx.doi.org/10.11113/mjfas.v14n1-2.958

Griffin W.L., Powell W., Pearson N.J., O’Reilly S.Y. (2008) GLITTER: Data reduction software for laser ablation ICP-MS. In P. Sylvester, Ed., Laser Ablation ICP-MS in the Earth Sciences: Current Practices and Outstanding Issues. Mineralogical Association of Canada, Québec, pp. 308–311.

Haüy R.J. (1801) Traité de Minéralogie. Chez Louis, Paris.

Henckel J.F. (1737) De Topasio vera Saxonum, orientali non inferiore. Acta Physico-Medica Academiae Caesareae Leopoldino-Carolinae Naturae Curiosorum, Vol. 4, pp. 316–320.

Hoover D.B., Theisen A.F. (1993) Fluorescence excitation-emission spectra of chromium-containing gems: An explanation for the effectiveness of the crossed filter method. Australian Gemmologist, Vol. 18, No. 6, pp. 182–187.

Jarosewich E. (2002) Smithsonian microbeam standards. Journal of Research of the National Institute of Standards and Technology, Vol. 107, No. 6, pp. 681–685, https://doi.org/10.6028/jres.107.054

Jäschke U., Unger B. (2007) Der Vogtlandatlas. Regionalatlas zur Natur, Geschichte, Bevölkerung, Wirtschaft, Kultur des sächsischen Vogtlands. Klaus Gumnior, Chemnitz, Germany.

Jiang X., Zhang Z., Wang Y, Kong F. (2020) Gemmological and spectroscopic characteristics of different varieties of amber from the Hukawng Valley, Myanmar. Journal of Gemmology, Vol. 37, No. 2, 144–162.

Jochum K.P., Weis U., Stoll B., Kuzmin D., Yang Q., Raczek I., Jacob D.E., Stracke A., Birbaum K., Frick D.A., Günther D., Enzweiler J. (2011) Determination of reference values for NIST SRM 610–617 glasses following ISO guidelines. Geostandards and Geoanalytical Research, Vol. 35, pp. 397–429, http://dx.doi.org/10.1111/j.1751-908X.2011.00120.x

Jochum K.P., Weis U., Schwager B., Stoll B., Wilson S.A., Haug G.H., Andreae M.O., Enzweiler J. (2016) Reference values following ISO guidelines for frequently requested rock reference materials. Geostandards and Geoanalytical Research, Vol. 40, No. 3, pp. 333–350, http://dx.doi.org/10.1111/j.1751-908X.2015.00392.x

Jones Z., Hinds J., Woznichak S., Calamai A. (2020) Revisiting the room-temperature metastable 2E lifetime in ruby for an upper division phosphorescence laboratory experiment. Journal of Undergraduate Reports in Physics, Vol. 30, No. 100004, http://dx.doi.org/10.1063/10.0002044

Kern J.G. (1776) Vom Schneckensteine oder dem sächsischen Topasfelsen. Edited and published by I.E. von Born. Wolfgang Gerle, Prague.

Kisliuk P., Moore C.A. (1967) Radiation from the 4T2 state of Cr3+ in ruby and emerald. Physical Review, Vol. 160, No. 2, pp. 307–312, http://dx.doi.org/10.1103/PhysRev.160.307

Kruzslicz Á.B., Nasdala L., Wildner M., Škoda R., Redhammer G.J., Hauzenberger C., Wanthanachaisaeng B. (2020) Black spinel – a gem material from Bo Phloi, Thailand. Journal of Gemmology, Vol. 37, No. 1, pp. 66–79.

Krzemnicki M.S. (2017) Rarities and collector stones recently tested at SSEF. Facette, No. 23, pp. 8–10.

Lahl B. (2012) Königliche Topase vom Schneckenstein – Edelsteine aus dem Vogtland. Chemnitzer Verlag, 144 pp.

Leithner H. (2008) Famous mineral localities: The Königskrone topaz mine, Schneckenstein, Saxony, Germany. Mineralogical Record, Vol. 39, No. 5, pp. 355–367.

Luo Y., Breeding C.M. (2013) Fluorescence produced by optical defects in diamond: measurement, characterization, and challenges. G&G, Vol. 49, No. 2, pp. 82–97, http://dx.doi.org/10.5741/GEMS.49.2.82

Marfunin A.S. (1979) Spectroscopy, Luminescence and Radiation Centers in Minerals. Springer, Berlin, 352 pp.

Mohs F. (1822) Grund-Riß der Mineralogie. Erster Theil: Terminologie, Systematik, Nomenklatur, Charakteristik. Arnold’sche Buchhandlung, Dresden.

Nasdala L., Wildner M., Giester G., Chanmuang N. C., Scicchitano M.R., Hauzenberger C. (2021) Blue dravite (“indicolite”) from the Elahera gem field, Sri Lanka. Journal of Gemmology, Vol. 37, No. 6, pp. 618–630.

O’Bannon E.F., Williams Q. (2019) A Cr3+ luminescence study of natural topaz Al2SiO4(F,OH)2 up to 60 GPa. American Mineralogist, Vol. 104, No. 11, pp. 1656–1662, http://dx.doi.org/10.2138/am-2019-7079

Petrov I. (1977) Farbuntersuchungen an Topas. Neues Jahrbuch für Mineralogie, Abhandlungen, Vol. 130, No. 3, pp. 288–302.

——— (1978) Farbe, Farbursachen und Farbveränderungen bei Topasen. Zeitschrift der Deutschen Gemmologischen Gesellschaft, Vol. 27, pp. 3–11.

Petrov I., Schmetzer K., Eysel H.H. (1977) Absorptionsspektren von Chrom in Topas. Neues Jahrbuch für Mineralogie Monatshefte, Vol. 8, pp. 365–372.

Pinheiro M.V.B., Fantini C., Krambrock K., Persiano A.I.C., Dantas M.S.S., Pimenta M.A. (2002) OH/F substitution in topaz studied by Raman spectroscopy. Physical Review B, Vol. 65, pp. 1–6, http://dx.doi.org/10.1103/PhysRevB.65.104301

Ribbe P.H., Rosenberg P.E. (1971) Optical and X-ray determinative methods for fluorine in topaz. American Mineralogist, Vol. 56, pp. 1812–1821.

Schott S., Rager H., Schürmann K., Taran M. (2003) Spectroscopic study of natural gem quality “Imperial”-topazes from Ouro Preto, Brazil. European Journal of Mineralogy, Vol. 15, No. 4, pp. 701–706, http://dx.doi.org/10.1127/0935-1221/2003/0015-0701

Schröder M. (1915) Erläuterungen zur geologischen Spezialkarte des Königsreiches Sachsen, Nr. 144, Blatt Falkenstein. Wilhelm Engelmann, Leipzig, 81 pp.

Schrön W. (1968) Ein Beitrag zur Geochemie des Germaniums. Chemie der Erde, Vol. 27, pp. 193–251.

Sebastian U. (2013) Die Geologie des Erzgebirges. Springer Spektrum, Berlin, Heidelberg, 270 pp.

Seim R., Schweder P. (1969) Untersuchungen zum Germaniumgehalt im Topas. Chemie der Erde, Vol. 28, pp. 83–90.

Smith C.P. (2020) ColorCodexTM – A new tool for the gemstone and jewelry industry. InColor, No. 45, pp. 84–90.

Taran M.N., Tarashchan A.N., Rager H., Schott St., Schürmann K., Iwanuch W. (2003) Optical spectroscopy study of variously colored gem quality topazes from Ouro Preto, Minas Gerais, Brazil. Physics and Chemistry of Minerals, Vol. 30, No. 9, pp. 546–555, http://dx.doi.org/10.1007/s00269-003-0356-9

Tarashchan A.N., Taran M.N., Rager H., Iwanuch W. (2006) Luminescence spectroscopic study of Cr3+ in Brazilian topazes from Ouro Preto. Physics and Chemistry of Minerals, Vol. 32, No. 10, pp. 679–690, http://dx.doi.org/10.1007/s00269-005-0042-1

Tichomirowa M., Leonhardt D. (2010) New age determinations (Pb/Pb zircon evaporation, Rb/Sr) on the granites from Aue-Schwarzenberg and Eibenstock, Western Erzgebirge, Germany. Zeitschrift für Geologische Wissenschaften, Vol. 38, No. 1–2, pp. 99–123.

Toya T., Kato A. (1983) JEOL Practical techniques for microprobe analysis. JEOL Training Center, Tokyo, 193 pp.

Tsai T.-H., D’Haenens-Johansson U.F.S. (2021) Rapid gemstone screening and identification using fluorescence spectroscopy. Applied Optics, Vol. 60, No. 12, pp. 3412–3421, http://dx.doi.org/10.1364/AO.419885

Twelvetrees W.H., Petterd W.F. (1897) On the topaz quartz porphyry or stanniferous elvan dykes of Mount Bischoff. Papers and Proceedings of the Royal Society of Tasmania, pp. 119–128.

Vollstädt H., Lahl B. (1997). Der Schneckenstein. In M. Glas, Ed., Topas – Das prachtvolle Mineral, der lebhafte Edelstein. extraLapis, No. 13, pp. 26–37.

Whitney D.L., Evans B.W. (2010) Abbreviations for names of rock-forming minerals. American Mineralogist, Vol. 95, No. 1, pp. 185–187, http://dx.doi.org/10.2138/am.2010.3371

Wilson W.E. (1995) Fabien Gautier d’Agoty and his ‘Histoire Naturelle Regne Mineral’ (1781). Mineralogical Record, Vol. 26, No. 4, pp. 65–76.

Wright J.H., Kwak T.A.P. (1989) Tin-bearing greisens of Mount Bischoff, northwestern Tasmania, Australia. Economic Geology, Vol. 84, No. 3, pp. 551–574, http://dx.doi.org/10.2113/gsecongeo.84.3.551

Zeug M., Nasdala L., Wanthanachaisaeng B., Balmer W.A., Corfu F., Wildner M. (2018) Blue zircon from Ratanakiri, Cambodia. Journal of Gemmology, Vol. 36, No. 2, pp. 112–132.

Zhang Z., Jiang X., Wang Y., Kong F., Shen A.H. (2020) Fluorescence characteristics of blue amber from the Dominican Republic, Mexico, and Myanmar. G&G, Vol. 56, No. 4, pp. 484–496, http://dx.doi.org/10.5741/GEMS.56.4.484