Dyed Chalcedony Imitation of Chrysocolla-in-Chalcedony

Chrysocolla-in-chalcedony, also known as gem silica or blue chalcedony in Taiwan, is the most valuable chalcedony variety on the Taiwanese market. The beautiful greenish blue color is derived from micro-inclusions of chrysocolla, which can be identified by observation of a peak at 3619 cm–1 in the Raman spectrum. This peak can be assigned to OH groups in chrysocolla. Therefore, the color origin for this material is fundamentally rooted in the presence of Cu2+ ions in the structure of the chrysocolla inclusions. In the past few years, a large number of dyed chalcedony imitations have appeared in Taiwan’s market. The blue color of chalcedony dyed by copper salts, and that of natural specimens containing chrysocolla, is caused by Cu2+ ions.
Recently, a parcel of loose chalcedonies was sent to the Taiwan Union Lab of Gem Research (TULAB) for identification. These stones were submitted as natural blue chalcedony, but Raman spectroscopy later confirmed them as chalcedony without the characteristic peaks of chrysocolla (figure 1).

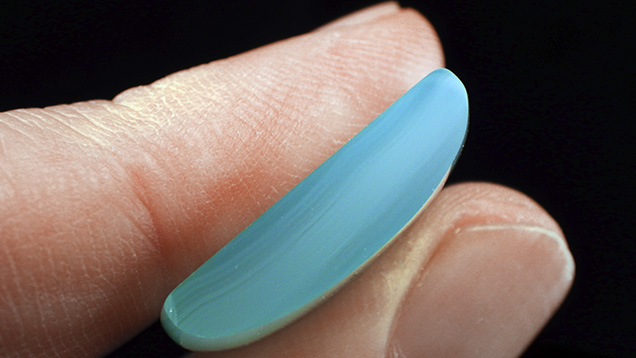
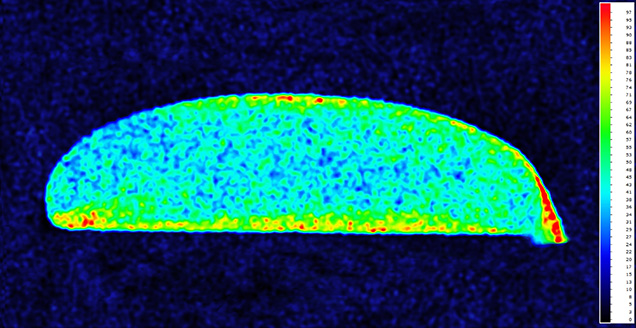
With the owner’s consent, we cut one cabochon and polished the cross section displaying a blue mantle zoning from surface to center parallel to its profile (figure 2). The sample was analyzed with EDXRF, and concentration mapping on the cross section confirmed that copper was concentrated on the surface and decreased toward the interior, which is strong evidence for dyeing with copper salts (figure 3).

Twenty pieces of chalcedony dyed with copper salts were further analyzed with EDXRF and compared to results from twenty pieces of natural blue chalcedony. EDXRF results indicated that the Si/Cu ratio of chalcedony dyed with copper salts was much higher than that of natural blue chalcedony (400–600 and 4–50, respectively). The content of Cu was relatively low in dyed chalcedonies tested.
There are many types of dye used for the color enhancement of chalcedony. Although a series of tests like those used above provide a comprehensive comparison between natural blue chalcedony and the dyed chalcedony analyzed in this research, it requires further verification whether these methods can be applied to other dyed chalcedonies.


