Color Characteristics of Blue to Yellow Beryl from Multiple Origins
ABSTRACT
Aquamarine and heliodor are colored by Fe ions, an important coloring agent for beryl. Blue to yellow gem beryl was studied by quantitative spectroscopy and trace-element analytical techniques to explore color characteristics and chromophores. Blue color was caused by a 600 nm absorption, while yellow color was attributed to an absorption edge in the violet-blue region. Color ranged from blue to green to yellow due to different proportions of Fe ions with various valences and occupancies. Mn content was positively related to Fe, but abundant Mn ions showed no impact on color (unlike Mn in morganite and red beryl). The arrangement of alkali ions and water in channel and the charge compensation mechanism of beryl are discussed. Alkali ions (mainly Na and Cs) and water were localized in the peanut-shaped channels, and all alkali elements (Li, Na, K, Rb, and Cs) were relevant. Though alkali ions and water interacted with transition metal Fe and Mn ions, their influence on blue to yellow color was indirect and rather weak.
INTRODUCTION
Gem beryl is a significant gem species, including color varieties such as emerald, aquamarine, heliodor, goshenite, morganite, and red beryl. Blue to yellow beryl has been found in numerous locations, including Brazil, South Africa, Russia, Ukraine, Canada, Myanmar, the United States, Afghanistan, and China (Belakovskiy et al., 2005).
Blue color in aquamarine and yellow color in heliodor are attributed to abundant Fe ions (Wood and Nassau, 1968). Fe ions are also present in all other color varieties of beryl, though Fe content is relatively low in morganite. Although discussions on the role of Fe ions in blue to yellow beryl are not new, they have mainly focused on crystal physics and chemistry. This article explores the color characteristics and chromophore ions of blue to yellow beryl using quantitative chemical and spectral analysis.
The crystal structure of beryl is unique for having a peanut-shaped “channel” along the c-axis, and alkali ions in this channel interact with transition metal ions. Therefore, we will discuss the features of alkali elements and their roles in beryl color, based on analysis of the channel mechanism. This research was part of a series of ongoing studies on the color characteristics of beryl.
MATERIALS AND METHODS
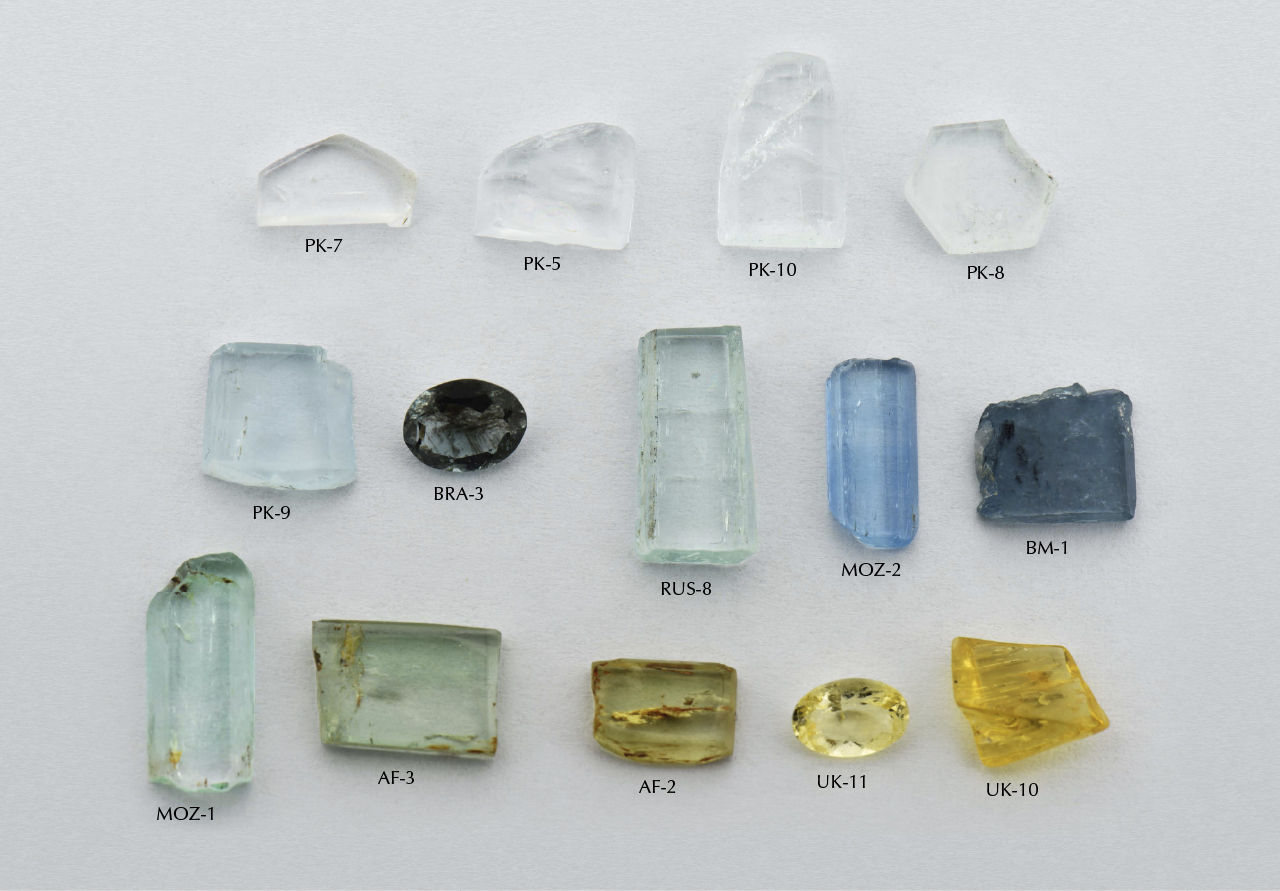
Beryls from different origins were gathered and 14 of them with various color and alkali content were selected for this study (see table 1). They were classified in the following color varieties: goshenite (colorless to near-colorless), aquamarine (greenish blue to blue), green beryl (green to yellowish green), and heliodor (greenish yellow to yellow). With the exception of two faceted stones and one rough stone, the samples were fabricated as optical wafers perpendicular (PK-7 and PK-8) or parallel (PK-5, PK-10, PK-9, RUS-8, MOZ-2, BM-1, MOZ-1, AF-3, and AF-2) to the c-axis (figure 1).

All samples were investigated by standard gemological testing, Raman spectroscopy, Fourier-transform near-infrared (FT-NIR) and ultraviolet/visible/near-infrared (UV-Vis-NIR) spectroscopy, and laser ablation–inductively coupled plasma–mass spectrometry (LA-ICP-MS) chemical analyses. Inclusions were captured using a Leica M205A microscopic system with oblique fiber-optic illumination. Raman spectra were collected by a Bruker Senterra R200 spectrometer coupled with a 532 nm laser for identifying various inclusions. The resolution was set at 5 cm–1 with a 20 second integration time, 2 accumulations, and 20 mV laser energy. To explore the characteristics of water in the beryl, FT-NIR was performed using a Bruker V80 FTIR spectrometer at 2 cm–1 resolution and 32 accumulations. To study the color features, UV-Vis-NIR spectra were recorded with a PerkinElmer 650s spectrophotometer equipped with a 150 nm integrating sphere accessory at 1 nm resolution.
Chemical analysis was performed by LA-ICP-MS using an Agilent 7500a and 7900 ICP-MS instrument combined with a GeoLas 193 nm laser. The carrier gas used in the laser ablation unit was He with a flow rate set at approximately 650 mL/min. Laser ablation conditions consisted of a 44 μm diameter laser spot size, a fluence of 5–6 J/cm2, and a 6–8 Hz repetition rate. Each analysis incorporated a background acquisition time of approximately 20–30 seconds followed by 50 seconds of ablation. A multi-standard quantitative calculation method was adopted, with Al chosen as the normalizing element. Calibration standards of NIST 610, BCR-2G, BHVO-2G, and BIR-1G were used as external references (Liu et al., 2008). Three laser spots for each sample were applied in an area that was typically clean with an even color distribution. UV-Vis-NIR spectra were collected in the same area analyzed by LA-ICP-MS.
RESULTS
Gemological Properties. The beryl samples had a refractive index range of ne=1.568–1.579 and no=1.573–1.586, with birefringence between 0.005 and 0.006, with the exception of samples BM-1 and BRA-3. Pale green MOZ-1 had the lowest RI (1.568–1.573) among all the samples. Burmese deep blue sample BM-1 and Brazilian dark greenish blue BRA-3 had the highest RI (1.589–1.600) and birefringence (0.009–0.010). All the beryl samples displayed weak to moderate dichroism. All bluish beryl samples showed more blue color along the e-ray than the o-ray. It should be noted that the dark hue of sample BRA-3 was caused by extremely tiny cloudy dark inclusions throughout nearly the whole sample. The lemon and yellow heliodor samples showed weak dichroism but a relatively saturated color.
Microscopic Observation. Two-phase inclusions were the most common type in the beryl samples, containing one gas bubble (CO2) floating in at least one kind of fluid (figure 2). Minor CH4, H2S, and N2 were found only in some of the Pakistani beryl samples. Normally the Pakistani samples had two liquid phases (CO2 and water with minor dissolved CO2), while samples from other deposits hosted one liquid phase (water). Sometimes a mineral phase was hosted in the fluid, such as native sulfur and orpiment in Pakistani samples (see figure 3). Two-phase inclusions had hexagonal, elongated, round, oval, angular, needle-like, or other irregular shapes. They were generally distributed along healed fissure planes forming “fingerprint-like” inclusions or isolated (again, see figure 2).


Our heating experiments indicated that two-phase inclusions transformed after heat treatment at 400°C or higher. Before heat treatment, a round bubble was floating on the fluid phase (figure 4, left). While cooling the sample to room temperature after heating to 300° and 400°C, we photographed the same two-phase inclusion (figure 4, middle and right). The round bubble disappeared after heating above 400°C. Raman analysis of this two-phase inclusion detected no gas or fluid. We concluded that micro-cracks occurred after heating above 400°C, allowing the gaseous and fluid phase to escape and leaving the empty two-phase inclusion (recognizable by its original shape and distribution). Yellowish and greenish beryl are usually heated between 400° and 500°C to obtain a blue color, so this empty two-phase inclusion could potentially be used as evidence of heat treatment of aquamarine.

Various mineral inclusions could be detected by Raman spectroscopy. Tourmaline, albite, muscovite, garnet, zircon, and tantalite-columbite were typical in our samples (figure 5). Argentojarosite was identified only in Pakistani aquamarine, while bertrandite and siderite were recognized only in an aquamarine sample from Mozambique.

Trace Element Analysis. The alkali element and transition element contents (in ppmw) of all beryl samples from multiple localities are reported in table 2.

Alkali Elements. Among the alkali elements, Cs and Na concentrations were relatively enriched and Rb content was lowest in nearly all samples (table 2). In Burmese aquamarine BM-1, K content (72–219 ppmw) was the lowest rather than Rb (1375–1459 ppmw). The concentration of Li was less than Na in all of the samples. Nearly all samples had total alkali content (including Li, Na, K, Rb, and Cs) below approximately 6000 ppmw. Aquamarine MOZ-2 and goshenite PK-10 had the lowest total alkali content (1250–1350 ppmw on average). The alkali content of deep blue Burmese aquamarine BM-1 and dark blue Brazilian aquamarine BRA-3 differed noticeably from those of other samples. Li, Rb, and Cs contents were more than 10 times higher, and Na and K were 3–10 times higher (table 2). BM-1 had the richest Cs content (46510–47496 ppmw) reported for blue aquamarine.
Transition Metals. Concentration of Fe varied from 1355 to 9407 ppmw for all colorless and blue to yellow beryl samples (table 2). Among the samples, the colorless and near-colorless beryl (PK-10, PK-7, PK-8, and PK-5) had relatively low Fe (1355–1950 ppmw). Other saturated bluish beryl contained higher Fe content, even up to 9407 ppmw. The lemon yellow and golden-colored heliodor (UK-10 and UK-11) had Fe content between 2030 and 3812 ppmw, lower than bluish beryl samples of similar saturation.
Mn content was much lower than Fe in all samples (table 2). The concentration of Mn varied between 4 and 854 ppmw, and it was below 200 ppmw in most samples. Burmese deep blue beryl BM-1 and Brazilian dark greenish blue sample BRA-3 had relatively rich Mn (187–854 ppmw). The concentration of V and Cr in bluish and yellowish beryl samples was quite low to even below detection limits (table 2). But these concentrations were relatively rich in green beryl MOZ-1 (which averaged 262 ppmw V and 279 ppmw Cr). Besides alkali and transition elements, traces of Mg, Sc, Zn, Ga, Sn, and Ta were detected in some samples.
Spectroscopy Analysis. FT-NIR Spectroscopy. The type of water and its relative content in the channel was revealed quantitatively by its near-infrared absorption spectrum. Peaks in the NIR region represented the overtones and combinations of “type I” and/or “type II” water absorption. Most beryl samples contain “type I” water with peaks at 8699, 7142, 6816, 5436, 5271, and 5109 cm–1 (Wood and Nassau, 1967), such as PK-10 and PK-5 in figure 6. But Brazilian aquamarine BRA-3 and Burmese aquamarine BM-1 were dominated by strong “type II” water peaks at 7097, 7077, and 5275 cm–1 (Wood and Nassau, 1967) (blue trace in figure 6). Also, the peak intensity of type II water became stronger with increasing sodium content.

UV-Vis-NIR Spectroscopy. Quantitative UV-Vis-NIR spectra for the e-ray and o-ray were acquired for the beryl samples. The color circles of the beryl samples in figures 7–10 were calculated from visible spectra between 380 and 780 nm using GRAMS software, when the sample thickness was normalized to 4 mm. In order to discuss the impact of Fe on coloration, we converted ppmw to ppma in the UV-Vis-NIR region by the following formulation: ppma = [(atomic weight of beryl/number of atoms for beryl)/atomic weight of Fe] ∙ ppmw value = [(537.49/29)/55.85] ∙ ppmw value. That is, ppma value = 0.3318 ppmw value.

All blue to yellow beryl samples showed the typical iron absorption in their UV-Vis-NIR spectra. Peaks at 372 and 427 nm related to Fe3+ ions (Wood and Nassau, 1968) were observed in all samples (figures 7–9). These 372 and 427 nm peaks were more or less covered by the absorption edge in the violet-blue region in the yellowish beryl samples. They were even invisible in lemon yellow and golden heliodor (UK-10 and UK-11) (figure 7). These 372 and 427 nm peaks did not contribute to color because of their rather weak absorption.
The absorption edge in the violet-blue region leads to yellowish color in beryl. There was no obvious difference between the o-ray and the e-ray. This absorption edge was assigned to Fe3+ ions (Wood and Nassau, 1968). The absorption edge was present in all beryl samples, and it was in the ultraviolet region for beryl samples without yellowish color. When this absorption edge shifted to a longer wavelength from the violet-blue to the blue region, the yellow color occurred in beryl. Also, the intensity of this absorption edge was not proportional to total Fe content. For example, greenish yellow beryl AF-2 had the richest total Fe content (2088–2727 ppma) of the three yellowish samples, but the intensity of the absorption edge was weak compared with other yellow heliodor samples (see figure 7).
Bluish color in the beryl samples resulted from a distinct broad absorption around 600 nm in the e-ray. The 600 nm broad absorption band was present in the e-ray but quite weak in the o-ray (see figures 8 and 9), which was responsible for more blue color along the e-ray than the o-ray. This absorption was associated with Fe2+ or Fe2+-Fe3+ ion pairs (Wood and Nassau, 1968; Lin et al., 2013). With increasing Fe content, the 600 nm absorption band became stronger and the color became more saturated, from colorless, pale greenish blue, and medium blue to dark blue (from bottom to top in figure 8). Compared with Fe content in yellow heliodor with similar saturation, Fe ions were less efficient for coloring beryl blue than yellow: 600 ppma Fe in beryl could produce a relatively saturated yellow color. However, blue aquamarine with similar saturation should contain at least twice the Fe content.

A broad absorption band centered at about 820 nm was stronger in the o-ray than the e-ray (see figures 8 and 9). This 820 nm broad band overlapped with the 600 nm band in the e-ray. This band in the o-ray was related to Fe2+ (Wood and Nassau, 1968), and its intensity had nothing to do with total Fe content. For example, the 820 nm band intensity of Burmese aquamarine BM-1 was quite weak, contrary to the abundant Fe content (see figure 9). However, the intensity of the 820 nm band in the e-ray was not in proportional to that in the o-ray. And the intensity of the 820 nm band in the e-ray was nearly positive to the total Fe content (see figure 8). So we supposed that the origin of the 820 nm band was different between the e-ray and o-ray, maybe Fe2+ in different occupancy.

The tail of the 820 nm band reached the visible range, but its intensity in the visible range was quite weak. So this 820 nm broad absorption could not lead to any obvious color.
Pale green beryl MOZ-1 showed typical absorption of Cr3+ at 426 and 600 nm for the o-ray and 630 and 660 nm for the e-ray, as well as sharp R lines at 683 nm (Wood and Nassau, 1968). A weak V3+ absorption shoulder was also observed at about 400 nm (see figure 10). So this green color originated from Cr3+ and minor V3+ ions in beryl, similar to emerald. This absorption was totally different from yellowish green beryl AF-3 (no absorption spectra shown for this sample), which showed the absorption features of Fe ions, though they both had greenish color.

DISCUSSION
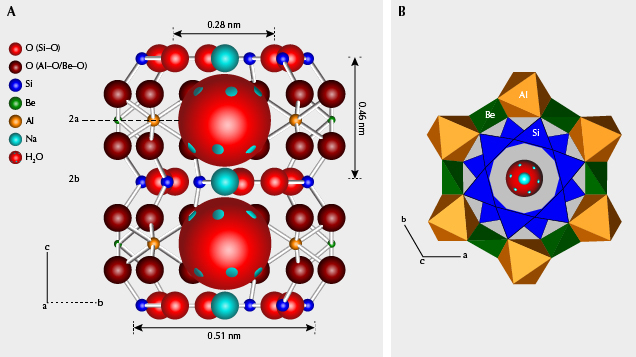
Crystal Structural Consideration. The crystal structure of beryl, with an ideal chemical formula Be3Al2(Si6O18), consists of smaller rings of six SiO4 tetrahedra and larger rings of alternating BeO4 tetrahedra and AlO6 octahedra (figure 11B). These two rings stack over each other along the c-axis, forming a peanut-shaped structural “channel” along the c-axis (figure 11A). Large ions such as Cs or water molecules would only fit within the large ring and be therefore localized at the 2a site and unable to migrate along the channel, because the ionic diameter of Cs+ (0.376 nm) and the dimension of a water molecule (0.28 × 0.32 × 0.37 nm) are too large to fit within the 2b site. Water molecules in beryl occur in two configurations: “type I” with H-H direction parallel to the c-axis, and “type II” with H-H direction perpendicular to the c-axis (Wood and Nassau, 1967). Water molecules are only free to rotate around the c-axis according to the hexagonal system (Gorshunov et al., 2016). Due to similar ionic radii and chemical properties, minor K+ and Rb+ ions in the channel behave like Cs+ ions. The smallest alkali ions coordinated in the 2b site, Na+, are stable because of Coulomb interactions between Na+ and adjacent type II water molecules (see again figure 11A).
Substitutions commonly occur in Be-O tetrahedra by Li+ ions, and in Al-O octahedra by transition metal ions and other ions (such as Mg, Ca, and Ti). With Li+ substituting for Be2+, slight deformation of Be-O tetrahedra and charge deficiency arise. Substitution of divalent cations in Al octahedra or trivalent cations in Be tetrahedra could also lead to charge deficiency. Alkali ions (mainly Cs+ and Na+) in the channel serve to charge balance (e.g., Li+ + transition metal ions + other substituted ions = Cs+ + Na+). Moreover, the substitution of transition metal ions mainly included Fe2+/Fe3+/Mn2+/Mn3+/Cr3+/V3+<=>Al3+, or in some cases Fe2+/Fe3+<=>Be2+.
Alkali Elements. The relative concentrations of each alkali element were nearly proportional in all beryl samples, showing similar variation (figure 12). This was in agreement with the charge balance principle, in which the charge deficiency arising from the substitution of Li are compensated by a proportional amount of Na and Cs plus minor K and Rb in the channel. But there were also some inconsistencies, especially the unexpectedly low K content in Burmese aquamarine BM-1. This proportional tendency may result from the process of crystallization in the mineralizing fluid with abundant Li, Na, K, Rb, and Cs at the same time.

The chemical fingerprint diagram of Li versus Cs content showed two concentrated areas, which could be considered the “low-alkali beryl” area (red circle in figure 13) and the “high-alkali beryl” area (blue circle in figure 13). Low-alkali beryl was dominated by type I water and high-alkali beryl by type II water analyzed by FT-NIR spectra. This was in agreement with the fact that Na+ coordinates with type II water molecules in the channel (see figure 11A) and each alkali was nearly proportional. Beryl samples from most localities were in the low-alkali beryl area including Pakistan, Russia, Africa, Mozambique, Italy (Bocchio et al., 2009), Vietnam (Huong et al., 2011), and Minas Gerais, Brazil (Viana et al., 2002). Although this Li-Cs plot could not be used to distinguish the exact geographic origin, it showed the possibility of separating blue to yellow beryl from locations worldwide by various chemical fingerprint diagrams.

Chromophores Fe and Mn. Concentrations of Fe and Mn showed an approximately positive relationship in blue to yellow beryl samples, though they were not quite proportional (figure 14). This positive relationship could be explained by Fe and Mn’s similar substitution behavior according to similar radii, ionic valence, and coordination. Mn and Fe ions were normally present as two possible valence states: +2 and +3 in beryl. Radii of Mn ions (approximate measurements of Mn2+: 0.066–0.083 nm; Mn3+: 0.058–0.064 nm) are quite similar to Fe ions (Fe2+: 0.063–0.078 nm; Fe3+: 0.049–0.054 nm) (Shannon, 1976). Both ions were more likely to substitute for Al3+ in the octahedral site due to suitable radii in beryl. Moreover, Fe and Mn ions could enrich together in mineralized fluid due to similar geochemical features. Therefore, blue to yellow beryl showed similar substitution behavior during crystallization.

The Chromophore Mn and Color. Mn ions in blue to yellow beryl did not impart an obvious red modification to the hue, and no obvious pink, purple, or orange hues were seen. Red beryl and morganite are considered to be colored by Mn2+ or Mn3+ (Nassau and Wood, 1968; Platonov et al., 1989; Fridrichová et al., 2017). Red beryl generally contains 2000 ppmw Mn (Shigley et al., 1984), and morganite has less than 200 ppmw Mn (authors’ unpublished data). However, our blue to yellow beryl samples with abundant Mn content showed no obvious absorption of Mn ions in UV-Vis-NIR spectra and a corresponding pink, orange, or purple color. For example, the Mn content of deep blue aquamarine BM-1 (568–854 ppmw) was nearly half that of red beryl. And the Mn content in Brazilian dark greenish blue aquamarine BRA-3 (287–292 ppmw) and greenish yellow sample AF-2 (116–160 ppmw) was close to morganite. This indicated that Mn ions in blue to yellow beryl do not play a role in coloration, and the valence or occupancy of Mn ions should differ from that in morganite or red beryl. The valence or occupancy of Mn ions may be affected by high Fe content (the Fe/Mn ratio was at least close to an order of magnitude greater). The valence, occupation, and coloration of Mn ions in beryl will be discussed in detail in a future study.
Blue to Yellow Color Characteristics. We determined that Fe ions in beryl could lead to yellow and blue colors. Blue color has been attributed to Fe2+ or Fe2+-Fe3+ pairs, and yellow color to Fe3+ (Wood and Nassau, 1968; Lin et al., 2013), though their accurate occupancy remains controversial. Recently, an alternative mechanism involving trapped electrons in the creation and the decay of the yellow color was proposed by Andersson (2013). But the exact configurations of the electron trap and the tetrahedral Fe3+ color center could not be determined. Due to different proportions of Fe ions with various valences and occupancies in beryl, color varied from yellow to greenish yellow, yellowish green, bluish green, greenish blue, and blue. The greenish color was normally modified by a yellowish or bluish component, such as yellowish green sample AF-3 and bluish green sample RUS-8. Green color could also be caused by other distinct coloration mechanisms, Cr3+ and/or V3+, the same as emerald (e.g., green beryl MOZ-1). But the green beryl had a lower color saturation than emerald due to inadequate Cr and/or V content.
Alkali and Color. The alkali ions showed no obvious impact on blue to yellow color of beryl. The alkali ions serve for charge deficiency arising from the substitution of some transition metals, but no corresponding relationship occurred between the alkali content and Fe/Mn content for blue to yellow beryl samples. This could be because at least some Fe and Mn ions substituted without charge deficiency (i.e., Fe3+/Mn3+<=>Al3+, or Fe2+/Mn2+<=>Be2+), or other substituted ions (such as Zn2+, Mg2+) participated in charge balance. Alkali ions, therefore, had no direct impact on the chromophores and their coloration of blue to yellow beryl. Nevertheless, our high-alkali beryl appeared to show deeper blue color. The additional dark hue of BRA-3 was caused by dark cloudy inclusions. It was worth noting that bluish samples could be “low-alkali” or “high-alkali” beryl, but all yellowish samples were “low-alkali” beryl. This manifested that the alkali may influence the valence or occupancy of Fe ions, but it required further confirmation.
Water and Color. Water type and its relative content played little role in the blue to yellow color of beryl. All blue to yellow samples contained both type I and type II water in the channel. Nor was there any relationship between the type I/type II water ratio and color hue or saturation. Water molecules were related to chromophores in beryl through Na ions, but Na ions showed no obvious impact on the coloration of blue to yellow beryl. Therefore, it was unlikely that water molecules would affect beryl’s blue to yellow color.
CONCLUSIONS
Blue to yellow gem beryl was studied by quantitative chemistry and spectroscopic properties to understand the chromophores and color characteristics. Blue color was caused by a broad absorption band at 600 nm, and yellow color was attributed to an absorption edge in the violet-blue region. Both were related to Fe ions in different valences and occupancies. Green beryl was colored by a combination of yellow and blue, or by Cr3+ and/or minor V3+. The concentration of Mn was somewhat positively related to Fe in blue to yellow beryl, but abundant Mn ions had no impact on color.
This study discussed the arrangement of alkali ions and water molecules within the structural channel, facilitating charge compensation among the channel species and aliovalent substitutions in the surrounding rings. Large Cs+, Rb+, K+ ions and water molecules were localized at the 2a site and were unable to migrate along the channel. The smallest ions (Na+) stably positioned at the 2b site, interacting with “type II” water. Non-nominal (not in chemical formula) alkali elements (Li, Na, K, Rb, and Cs) and water were relevant and played complex roles in beryl. However, we found the in fluence on blue to yellow color to be in direct and possibly weak.


