A New Method for Determining Gem Tourmaline Species by LA-ICP-MS
ABSTRACT
The gem world is rich with species of tourmaline such as the vivid greens of dravite, uvite, chromium-dravite, and vanadium-dravite; the pinks of elbaite and rossmanite; and the multicolored fluor-liddicoatite. To date, simple gemological tests to separate these various species, and many others of the tourmaline group, are lacking. Laser ablation–inductively coupled plasma–mass spectrometry (LA-ICP-MS) analysis is becoming a prevalent method to measure chemical composition in gemstones because it provides inexpensive, clean, fast, and largely nondestructive analyses. With adequate standards and calibration, this technique can quantitatively measure six common major elements in tourmaline (Na, Ca, Mg, Fe, Al, and Si) as well as trace elements (Cr, V). These data provide the basis for a simplified classification of gem tourmalines.Analyses of 14 tourmalines by both electron probe microanalysis (EPMA) and LA-ICP-MS for major and minor elements demonstrates that an LA-ICP-MS system with proper calibration, standardization, and normalization is capable of accurate measurements of six major elements in tourmalines, generally within ±10% error. While some volatile elements such as H, Li, B, and F cannot be measured reliably by this technique, a data reduction scheme can be implemented to calculate those elements based on select assumptions of concentrations of other major elements. Thus, LA-ICP-MS analysis is ideal for some tourmaline species determination in a gemological laboratory setting. The ability to provide a simple tourmaline species classification will enhance GIA identification reports and provide additional tools for identification.
INTRODUCTION
Tourmaline has been a much sought-after gemstone since the late 1800s. The Chinese Dowager Empress Tz’u Hsi was especially fond of pink tourmaline, which led to a dramatic increase in mining of the San Diego County pegmatites in the late nineteenth and early twentieth centuries (Fisher, 2002). Tiffany & Co. gemologist George F. Kunz popularized the stone when he wrote about the tourmaline deposits of Southern California (Kunz, 1905; Fisher, 2002). Many sources have produced gem-quality tourmaline for the jewelry market, including the states of Maine (Simmons et al., 2005) and California (Fisher, 2011) in the U.S. as well as Brazil (Proctor, 1985a,b; Koivula and Kammerling, 1989), Madagascar (Dirlam et al., 2002), Afghanistan (Bowersox, 1985), Mozambique (Abduriyim and Kitawaki, 2005; Laurs et al., 2008), and Nigeria (Smith et al., 2001; Garba, 2003; Laurs, 2015; Olatunji and Jimoh, 2017).
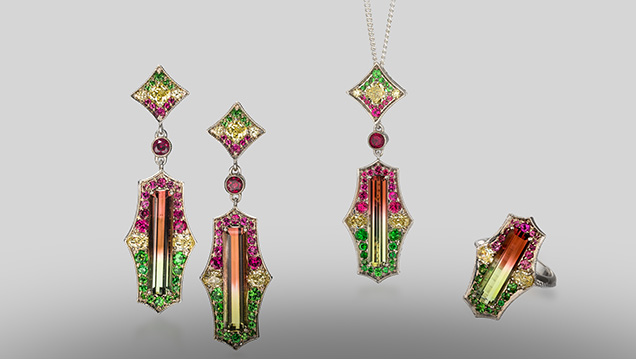
Tourmaline is mineralogically considered a supergroup because of the wide chemical variability possible in its structure, which leads to numerous species (e.g., Henry et al., 2011; Dutrow and Henry, 2011; Hawthorne and Dirlam, 2011). Tourmaline has an idealized chemical formula of XY3Z6(T6O18)(BO3)3V3W. The most common constituents are: [9] X= Na1+, Ca2+, K1+, ☐ (vacancy); [6] Y= Fe2+, Mg2+, Al3+, Li1+; [6] Z = Al3+, Fe3+, Mg2+; [4] T = Si4+, Al3+; [3] B = B3+; V = OH1– and O2–; and W = OH1–, F1–, and O2– (Hawthorne and Henry, 1999; Henry et al., 2011). To date, 33 species have been described (table 1). Elbaite, the most common gem tourmaline species, also has the largest color range (red, pink, green, blue, orange, yellow, colorless, and bicolored; figures 1 and 2). Liddicoatite (figure 3) is another important species of gem-quality tourmaline (although the type specimen is fluor-liddicoatite). Gem uvite is also known, commonly in shades of green, yellow, and brown (figure 4), as is an attractive orange gem dravite (figure 5).


In the gem and jewelry trade, tourmaline species are commonly determined visually based on their color rather than on accurate chemical analyses. However, tourmaline color is not species-specific (Dutrow, 2018). For example, a green tourmaline can be a dravite, uvite, chromium-dravite, vanadium-dravite, a vanadio-oxy-chromium dravite, or another species. Much of the brown and yellow tourmaline on the market is sold as dravite or uvite but could be elbaite. Many color-zoned tourmalines are labeled as elbaite or liddicoatite but may contain several different species. In many cases, it would be impossible for a person, even an experienced tourmaline dealer, to accurately distinguish different species with similar color hue and saturation, such as the red elbaite and red rossmanite in figure 6, the green elbaite and green uvite in figure 7, and the cuprian (Cu-bearing) liddicoatite and cuprian elbaite in figure 8. Cuprian elbaite was discovered in the 1980s, whereas cuprian liddicoatite was only recently reported (Katsurada and Sun, 2017). While elbaite is the most common gem-quality tourmaline, non-elbaitic tourmalines can have added value due to their rarity and novelty. And, as noted in the section below, stones similar to tourmaline may be intermixed. These market factors point to a demand for gemological laboratories to provide reliable tourmaline-species identification services.
 and rossmanite (right), identified by LA-ICP-MS.")
 and uvite (right), identified by LA-ICP-MS.")

The classification of tourmaline species was problematic until Hawthorne and Henry (1999) provided a systematic classification scheme. They modified the “50% rule” for ternary solid solutions and eased the determination of species by developing simple graphical representations. This classification scheme was further updated and refined by Henry et al. (2011), whose revised guidelines divided the supergroup into primary and secondary groups. However, the proper use of this classification scheme demands a precise and accurate chemical analysis.
A variety of analytical methods have been applied to measure tourmaline chemistry (e.g., Henry and Dutrow, 1990, 2001; Abduriyim et al., 2006; Tiepolo et al., 2006; Breeding and Shen, 2008; Okrusch et al., 2016; McMillan et al., 2017; Marger et al., 2017; Shinjo et al., 2017). In fact, a preliminary method to use LA-ICP-MS data to analyze gem tourmaline was proposed by Breeding and Shen (2008). However, electron probe microanalysis (EPMA) is the most widely accepted method to determine tourmaline species because it is capable of accurately and precisely measuring major and minor element chemistry even though it cannot determine directly transition metal valence or H, Li, or B values. Unfortunately, EPMA is expensive and time consuming. Most gemological laboratories do not possess the instruments and cannot justify the cost of outsourcing this analysis. Therefore, EPMA is not a practical everyday tool for a gemological laboratory. LA-ICP-MS, on the other hand, is a common analytical tool in many gemological labs due to the ease of analysis and the minimal sample preparation required.
Here we present a comprehensive method for using LA-ICP-MS analyses to accurately determine most tourmaline species. With this method we produce LA-ICP-MS data for major and minor element concentrations in tourmaline that closely match the values determined by EPMA. Consequently, it is possible for a gemological laboratory equipped with an LA-ICP-MS system to provide accurate species determinations using a simplified classification that does not distinguish between fluor-, oxy-, or hydroxy-tourmaline species. Gemological laboratories such as GIA’s can now offer species identification for gem-quality tourmaline.
MATERIALS AND METHODS
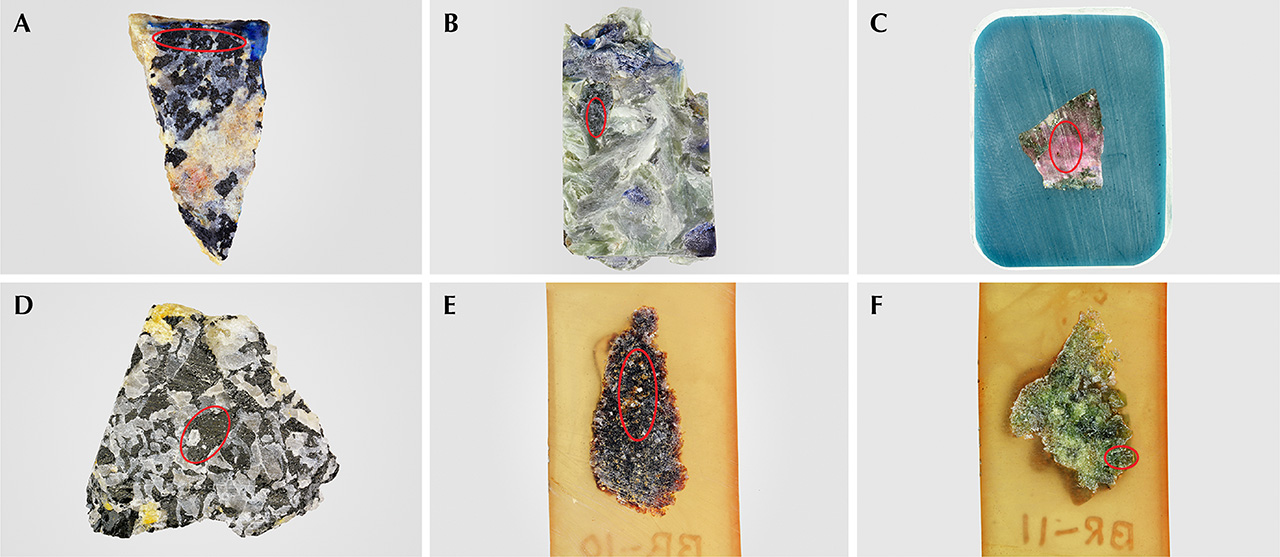
Samples. To develop a method for species identification by LA-ICP-MS, samples from a variety of chemical compositions were selected. Eight tourmaline samples—GIA-T1, T2, T3, T4, T5, T6, T7, and T8 (table 2, figure 9)—were obtained from the GIA Museum for this study. The samples were mounted in epoxy and polished (figure 9). Additionally, six samples of various compositions were obtained for analysis by both EPMA and LA-ICP-MS (table 2, BD-S1 to BD-S6; figure 10). These samples were billets, analyzed by LA-ICP-MS, from which the thin sections were made for the corresponding EPMA analyses.


LA-ICP-MS. For this study we used a Thermo Fisher iCAP Qc ICP-MS, coupled with a New Wave Research UP-213 laser ablation unit with a frequency-quintupled Nd:YAG laser (213 nm wavelength) running at 4 ns pulse width. Ablation was achieved using a 55 μm diameter laser spot size, a fluence (energy density) of approximately 10–12 J/cm2, and a 15 Hz repetition rate. Argon was used as nebulizer gas (0.73 L/min), auxiliary gas (0.8 L/min), and cooling gas (14 L/min). Helium, used as part of a carrier gas, has a flow rate of 0.8 L/min. Argon and helium gas flow, torch position, sampling depth, and lens voltage were optimized to achieve maximum sensitivity (counts per concentration) and low oxide production rates (232Th16O/232Th <1%). Ablated material was vaporized, atomized, and ionized by a plasma power of 1550 W. Data acquisition was performed in time-resolved mode. The dwell time of each isotope measured was 0.01 second except 27Al and 28Si, which were measured for 0.005 second. Gas background was measured for 20 seconds, while the dwell time of each laser spot was 40 seconds. Only the second half (20-second ablation) of the laser profile was used to calculate concentration, which eliminates surface contamination. 29Si was used as an internal standard. GSD-1G, GSE-1G (U.S. Geological Survey), and NIST 610 were used as external standards. 23Na, 24Mg, 27Al, 29Si, 43Ca, and 57Fe (the six major elements for species classification in gem tourmaline; see discussion below), along with other isotopes of trace elements, were selected for analyses. All isotopes were standardized using all three standards. Note that F, OH, and O cannot be analyzed by LA-ICP-MS and must be calculated. Internal standardization of data was initially processed by Qtegra software version 2.4 before proceeding with our normalization method (see the “Calculation Method for LA-ICP-MS Raw Data” section below).
A 10 μm diameter laser spot was used to mark four corners of a square area on the samples before performing EPMA analysis in the center of the area. After EPMA analysis, a 55 μm diameter laser spot was applied in the center of the same area to obtain the LA-ICP-MS results, which ensured the same regions of the tourmalines were analyzed by both methods.
EPMA. To obtain precise and accurate major and minor element chemistry for verification and validation of the LA-ICP-MS approach, six tourmaline samples were quantitatively analyzed by wavelength-dispersive spectrometry.
The samples in figures 9 and 11 (see Appendix 1) were analyzed at the California Institute of Technology on a JEOL JXA-8200 electron microprobe with an accelerating voltage of 15 kV and 20 nA current with a defocused beam of 10 micrometers. Standards employed were forsterite (Mg), fayalite (Fe), Mn olivine (Mn), phlogopite (F), albite (Na, Si), microcline (K), and anorthite (Ca). Analytical precision is estimated to be ±1% relative for the major elements and ±5% for the minor elements. Normalization procedures followed those suggested for EPMA by Henry et al. (2011). For Li-rich samples, Li was estimated based on the method described by Pesquera et al. (2016).
Although analyses could be further normalized to 15 YZT cations, that method is not performed here because of the uncertainty in the LA-ICP-MS data for Li.
The samples in figures 10 and 12 (see Appendix 2) were analyzed on the JEOL 8230 electron microprobe at Louisiana State University. Analyses were conducted at an accelerating potential of 15 kV and 5–15 nA using a 5–10 micrometer spot size. Several elements were analyzed but were present in trace amounts or below detection limits. Those are shown in the tables. Well-characterized natural minerals were used as standards, including andalusite (Al), diopside (Ca, Mg, Si), fayalite (Fe), chromite (Cr), kaersutite (Ti), rhodonite (Mn), willemite (Zn), albite (Na), sanidine (K), and apatite or fluor-phlogopite (F). Several well-characterized tourmalines served as secondary standards to ensure consistency among analyses. Analytical precision is estimated to be ±1% relative for the major elements and ±5% for the minor elements. Eight to twelve points were analyzed per sample to test for homogeneity and obtain a representative analysis (see Appendix 5). For unzoned crystals, the composition reported is the average from the points for that sample. For zoned crystals, average chemical analyses represent each distinct zone. The number of analyses per sample are given in the tables (again, see Appendix 2).
Calculation Method for LA-ICP-MS Raw Data. Tourmaline compositions are based on the calculation method from Henry et al. (2011) and Clark (2007), with modifications based on the additional limitations of LA-ICP-MS. LA-ICP-MS analysis for tourmaline provides an incomplete chemical characterization because critical light elements (H and F) and the oxidation states of transition elements (e.g., Fe and Mn) cannot be determined. While Li can be measured by LA-ICP-MS, we were unable to produce good tourmaline stoichiometry with our data when directly measuring Li. This is likely due to significant differential fractionation of Li between the glass standards and tourmaline. Such differential fractionation is a known problem for volatile light elements such as Li (Gaboardi and Humayun, 2009). Calculating tourmaline species from LA-ICP-MS data requires the following assumptions:
- Three boron cations per formula (i.e., no tetrahedral B).
- The sum of Y-, Z-, and T-sites equals 15 cations per formula. If Li is present, it is calculated to make up for site deficiency.
- The V- and W-sites are fully occupied by hydroxyl groups, although additional data reduction could produce the oxy species.
- Iron and manganese are divalent.
Consequently, the fluor- and oxy-tourmaline species cannot be determined. Future work will characterize oxy species. A full and detailed description of the formula and procedures for the calculation method is presented in Appendix 3
For clarity, a brief overview of the calculation method is presented here. Before the LA-ICP-MS analysis is performed, the correct concentration of the internal standard 29Si is unknown, and therefore the concentrations for the elements obtained initially are not correct on an absolute ppm scale. However, the concentrations of the various elements are all correct relative to each other because all elements are referenced to the concentration of Si. All of the major elements except for Li and B are converted into atomic proportions to determine the stoichiometric tourmaline formulae. The assumptions described above provide sufficient constraints so that a simple set of mathematical formulae can be used to determine the number of each cation per formula unit (see Appendix 3). Once these data are determined, the elements can be assigned to each of the specific tourmaline crystallographic sites outlined in Henry et al. (2011). Further, the total number of each cation on each site will determine the species of the tourmaline analyzed in most instances. With disordering in the oxy-species tourmalines, however, the exact formula is less certain. The more detailed and complete steps required for site assignments and species identification are provided in Appendix 4 and Appendix 5.
RESULTS AND DISCUSSION
Strengths of the Method. The method has three main strengths. First, Si is used as an internal standard (Okrusch et al., 2016). Elements with similar atomic masses are assumed to fractionate similarly. Consequently, the use of Si as an internal standard means short- and long-term fractionation is less problematic when measuring major elements with similar masses (Na, Mg, Al, Ca, and Fe) in tourmaline (e.g., Chen, 1999).
Second, three samples (GSD-1G, GSE-1G, and NIST 610) are used as external standards. It is optimal to select standards in which the elements being analyzed are at similar or higher concentrations than in the unknowns. The concentration ranges of Na, Mg, Al, Si, Ca, and Fe in GSD-1G and GSE-1G are similar to the concentration ranges of those elements in most tourmaline species.
Third, the procedure uses an optimized normalization method to post-process data. Typically, the value used for the internal standard concentration is derived from an external measurement such as EPMA (method 1). In this study, an internal standard concentration for 29Si is estimated and the data is renormalized to 100 wt.% to account for deviations from the initial Si value (method 2). A comparison between methods 1 and 2 using the data from eight GIA stones (GIA-T1 to GIA-T8) demonstrates excellent results. With method 1, the difference is within 3% relative for Na, Mg, Al, Si, Ca, and Fe (2.27% for Na, 2.91% for Mg, 2.27% for Al, 2.27% for Si, 2.27% for Ca, and 2.46% for Fe). These data further support the accuracy of our method. Not requiring a predetermined Si value from EPMA for internal standardization of LA-ICP-MS makes the method most suitable for tourmaline species determinations in gemological laboratories that are only equipped with LA-ICP-MS.
Simplified Tourmaline Species Classification for LA-ICP-MS Processed Data. The species classification presented here is a simplified version of the one presented in Henry et al. (2011), due to the limitations of LA-ICP-MS analysis. The inability to measure F or transition metal oxidation states by LA-ICP-MS does not allow determination of the V-site and W-site occupancy; we therefore cannot determine the fluor or oxy species. For example, fluor-elbaite would be elbaite in our simplified classification (table 1 and Appendix 3). Further, the assumption that all iron is divalent precludes determination of ferric iron-dominant species (table 1) such as povondraite and potassium-povondraite. Although olenite, tsilaisite, and adachiite can be determined by LA-ICP-MS, to the authors’ knowledge they have not been observed as gem-quality specimens. LA-ICP-MS measurements are not sufficiently precise (compared to EPMA analysis) to accurately separate hydroxyl- from oxy-tourmaline species.
Consideration of these limitations provides the following 11 tourmaline species. If the data falls outside these simplified classification categories, the tourmaline is assigned to alkali subgroups 3, 4, and 5, or calcic subgroups 3 and 4, or vacant subgroup 3 (Henry et al., 2011; table 1). None of these tourmaline species are considered in our method, as they are rarely encountered as gem-quality specimens. This simplified tourmaline classification is also illustrated using ternary plots in box A. Vanadium-dravite was redefined by Bosi et al. (2013) as oxy-vanadium-dravite. The following formulae for the species are hypothetical:
1. Dravite XNaYMg3ZAl6TSi6O18(BO3)3(OH)3(OH)
2. Vanadium-dravite XNaYMg3ZV6TSi6O18(BO3)3(OH)3(OH)
3. Chromium-dravite XNaYMg3ZCr6TSi6O18(BO3)3(OH)3(OH)
4. Schorl XNaYFe2+3ZAl6TSi6O18(BO3)3(OH)3(OH)
5. Elbaite XNaY(Li1.5Al1.5)ZAl6TSi6O18(BO3)3(OH)3(OH)
6. Uvite XCaYMg3Z(MgAl5)TSi6O18(BO3)3(OH)3(OH)
7. Feruvite XCaYFe2+3Z(MgAl5)TSi6O18(BO3)3(OH)3(OH)
8. Liddicoatite XCaY(Li2Al)ZAl6TSi6O18(BO3)3(OH)3(OH)
9. Foitite X□Y(Fe2+2Al)ZAl6TSi6O18(BO3)3(OH)3(OH)
10. Magnesio-foitite X□Y(Mg2Al)ZAl6TSi6O18(BO3)3(OH)3(OH)
11. Rossmanite X□Y(LiAl2)ZAl6TSi6O18(BO3)3(OH)3(OH)
|
Box A: Flowchart of the Simplified Tourmaline Species Classification |
|
The ternary plots shown in figure A-1 demonstrate how the nine tourmaline species described above are determined. Fluor or oxy species are not included in the flowchart. The Ca-Na-vacancy ternary plot establishes the dominance of the X-site in tourmaline (top row), which is the first step of species classification. The Al-Cr-V ternary plot determines the dominance of the Z-site (middle row), which narrows down the results and provides further discrimination. The Li-Fe-Mg ternary plot indicates the dominance of the Y-site and finally assigns the tourmaline to one of nine species (bottom row). 
Figure A-1. This flowchart illustrates the use of ternary plots to classify tourmaline species. Modified after Henry et al. (2011).
Detailed species classification criteria are shown in Appendix 5. An updated set of Al-Cr-V and Al-Cr-Fe ternary diagrams to establish species was generated by Henry and Dutrow (2018) for sodic oxy-tourmalines that contain significant amounts of Cr, V, and Fe3+. Future work will characterize oxy species by LA-ICP-MS. |
|
Box B: Tourmaline Analysis at GIA from Client Stone to Certificate: GIA Procedures for Tourmaline Species Classification. |
|
A bicolored tourmaline ring (see figure 1) demonstrates how jewelry is handled and analyzed at GIA laboratories. This same procedure was used to analyze the tourmalines in the bracelet shown in figure 13 and to detect two imitation stones. Analytical Procedure. The bicolored tourmaline ring was wiped cleaned to remove liquid and dust. It was secured with BlueTac in an orientation allowing access to the stone’s girdle (figure B-1A) and placed inside the sample chamber (figure B-1B). The ring was carefully placed to make sure that no part of it extended above the top of the sample chamber (figure B-1B). The sample chamber was put back under the laser and purged for 20 minutes before ablating (figure B-1C to B-1E) to minimize the background signal and fractionation. Three craters were ablated on the girdle of the stone (figure B-1F). The diameter of the round craters (laser spots) was approximately 55 μm, smaller in that of human hair—effectively invisible to the unaided eye and difficult to see with a 10× triplet loupe. The amount of tourmaline powder ablated from the three spots is minimal and does not result in any noticeable weight loss, demonstrating that the method is minimally destructive and does not affect the appearance of the stone. The ablated material was then transported via argon and helium carrier gases to the plasma to be ionized (figure B-1G). The gaseous ions were deflected to pass through a quadrupole mass analyzer to be separated according to their mass-to-charge ratio, until they finally reached the detector (figure B-1H). The LA-ICP-MS system used by GIA is shown in figure B-1I. 
Figure B-1. This flowchart shows how a tourmaline ring was analyzed by LA-ICP-MS at GIA. Photos by Ziyin Sun.

Figure B-2. Left: Ternary system for the primary tourmaline groups based on the dominant occupancy of the X-site. The tourmaline center stone on the ring belongs to the alkali primary group, the first step of species classification. Center: Ternary diagram for the Al-V-Cr subsystem for the dominant occupancy of the Z-site. Al3+ is the dominant trivalent cation on the Z-site. Right: Ternary dravite-schorl-elbaite subsystem based on the dominant occupancy of the Y-site. Li+ is the dominant monovalent cation on the Y-site. The species of tourmaline for both the red and the green color zoning in the ring is elbaite.
Data Process and Species Classification. After analysis, the LA-ICP-MS data was renormalized to calculate site assignment, which was further used for species classification (Appendix 3 and Appendix 4). The data of each stone (table 3) was saved in GIA’s colored stone database for rechecking and placed in corresponding tourmaline ternary classification plots (e.g., figure B-2) to provide a good visual representation for gemologists. 
|
Comparison of LA-ICP-MS and EPMA Data. Eight gem-quality tourmaline rough samples, GIA-T1 to GIA-T8 (see table 2 and figure 9) were tested initially. The agreement between EPMA and LA-ICP-MS analyses using the method described in this article was generally very good (figure 11). The error for major elements Si, Al, Na, Ca, Fe, and Mg was generally within 5–10%. Al values were systematically higher by LA-ICP-MS, while Si was generally slightly lower by LA-ICP-MS than EPMA. LA-ICP-MS measurements of Fe were generally within 10% at higher concentrations, but the difference was greater at low concentrations due to lower precision of EPMA in this range (<0.2 wt.% oxide; see figure 11E). The full chemical composition of these eight tourmaline samples is shown in Appendix 1.

Six additional tourmaline samples (table 2, BD-S1 to BD-S6; figure 10) were analyzed by both EPMA and LA-ICP-MS, with the results shown in figure 12. The difference between EPMA and LA-ICP-MS for Si, Al, Na, Ca, Fe, and Mg was within 3.5%, 7.5%, 6%, 5.5%, 8.5%, and 10.5%, respectively. The more detailed data comparison (including other trace elements) is shown in Appendix 2.

Overall, the comparison of EPMA and LA-ICP-MS data demonstrates that LA-ICP-MS analysis can measure major and minor elements with sufficient accuracy to determine tourmaline species.
CONCLUSIONS
Comparing LA-ICP-MS data to highly precise and accurate EPMA data for major elements on our samples demonstrated that some tourmaline species can be determined solely by LA-ICP-MS. The new method described here (1) allows for inexpensive, clean, fast, and largely nondestructive analysis of tourmaline gemstones by LA-ICP-MS and (2) uses this data to determine a general species. The method is suitable for gemological laboratories equipped only with LA-ICP-MS. Many large complex jewelry pieces, such as the rainbow tourmaline bracelet in figure 13, mounted with 33 square step-cut stones, can be easily analyzed with good precision and accuracy. As shown here, the method permits the identification of imitations that are intermingled with the tourmalines.

LA-ICP-MS is generally chosen to measure minor or trace elements and is considered less accurate due to interferences and matrix effects that cannot be corrected entirely. With carefully chosen internal standards and further development of external standards, however, our LA-ICP-MS method can produce data comparable to EPMA measurements of the same gem tourmaline samples. The ability to accurately measure the range of chemical compositions found in gem tourmaline using LA-ICP-MS allows GIA to help the colored stone industry better understand the varieties of tourmaline being bought and sold.


