Causes of Iridescence in
Natural Quartz
ABSTRACT
Iris quartz specimens from geodes in the Deccan Trap basalts of west-central India have been described since 1860. These quartz crystals exhibit dominant terminal faces, and iridescence is visible on only the minor z {011} faces and not the major r {101} faces. For this study, we analyzed iris quartz crystals from India’s Jalgaon District using scanning and transmission electron microscopy (SEM and TEM) and atomic force microscopy (AFM). SEM and AFM imaging revealed that the iridescent z faces exhibit periodic ridges with wavelengths from 400 to 700 nm, but no surface topography was apparent on the non-iridescent r faces. TEM examination of a section removed from a z face by focused ion beam (FIB) milling suggests that the ridge and valley structures were produced by preferential etching of periodic defects on the z faces, creating a diffraction grating. We interpret these defects as paired Brazil twin boundaries.
INTRODUCTION
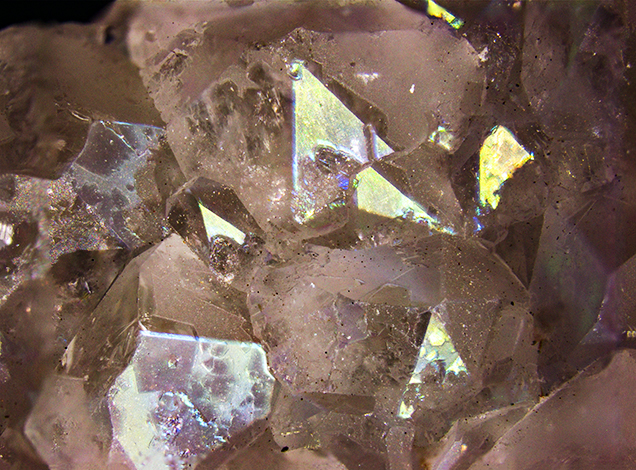
Iridescent solids exhibit a color change in response to variations in the lighting angle and viewing direction (figure 1). As exemplified by opal and labradorite, this phenomenon can transform an otherwise lackluster mineral into a gem, and many techniques have been developed to generate a play of light in non-iridescent stones. Applications for iridescent materials have attracted attention in diverse research fields, including photonics and computer graphics, while studies of the physics of iridescence have informed the design of cosmetics, paints, and anti-counterfeiting devices (Parker and Townley, 2007; Vigneron et al., 2007). Moreover, the functional significance of iridescence in organic structures is an active area of exploration in evolutionary and developmental biology (reviewed in Meadows et al., 2009). Here we describe the two physical mechanisms by which iridescence occurs in natural materials, and we report the results of our investigations into the cause of iridescence in naturally formed quartz crystals from India’s Jalgaon District.
BACKGROUND: PHYSICS OF IRIDESCENCE
Iridescence may be caused by the interference of light either by thin films or by repetitive substructures.
Thin-Film Iridescence. Thin-film interference effects are seen when a liquid or solid is coated by a film that is nanometers to micrometers in thickness. When incident light strikes the thin film’s surface, a portion of the light is transmitted through the interface and the remainder is reflected. After the transmitted light impinges the lower boundary of the film, some or all of that light wave may be reflected. The two waves reflected from the thin film’s upper and lower boundaries interfere with each other to produce a new light wave (figure 2). If, after its extended travel path and possible phase shift, the ray that reflects off the thin film/substrate boundary (ray 2 in figure 2, left) is exactly in phase with the wave that reflects only from the thin film surface (ray 1 in figure 2, left), the two reflected waves will constructively interfere and combine into a light wave with high intensity; otherwise, the emergent waves interfere destructively and are canceled (figure 2, right). If the source is monochromatic, the interference pattern generated by the reflected light waves will appear as bright and dark bands as a function of the viewing angle.
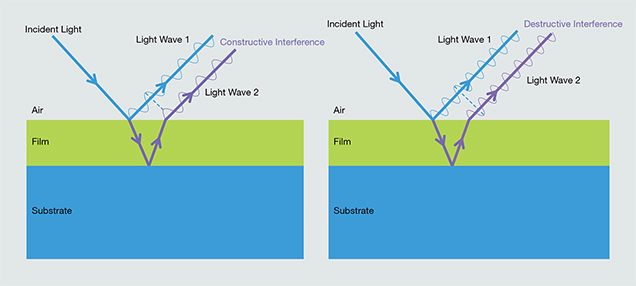
When the incident light is polychromatic, only one wavelength will be reinforced by constructive interference for a given reflection angle. As a result, thin-film interference is selective for specific wavelengths depending on the angle. Longer wavelengths interfere at steeper angles according to Bragg’s law, and thus a full rainbow spectrum is evident when the film is viewed from a perspective that samples a range of reflection angles. In addition, the colors associated with the iridescence depend on the thickness of the thin film and on the relative refractive indices (RIs) of the film and substrate. Refractive indices play a role because reflected light waves experience a phase shift of 180° when the RI of the thin film is lower than that of the substrate. Examples of minerals showing thin-film iridescence include bornite (Buckley and Woods, 1983; Vaughan et al., 1987) and fire obsidian (Ma et al., 2001, 2007). Likewise, many fractures in minerals, filled or unfilled, can display iridescence because of thin-film effects.
Iridescence from Diffraction Gratings. The dispersion of light can also be induced by interference effects that arise from natural diffraction gratings within or on the surfaces of minerals. The interaction of light with the diffraction grating can be purely reflective from surface grooves (figure 3), or it can be transmissive through transparent modular substrutures with periodic variations in refractive indices (Kinoshita et al., 2008). When light reflects from a blazed surface grating, as shown schematically in figure 3, waves that reflect from adjacent grooves will constructively interfere only when the emergent waves are in phase. When the reflected waves are out of phase, destructive interference ensues. The criterion for constructive interference is met when the difference in the distances traveled by light waves scattered from adjacent grooves is equal to an integral number of wavelengths.
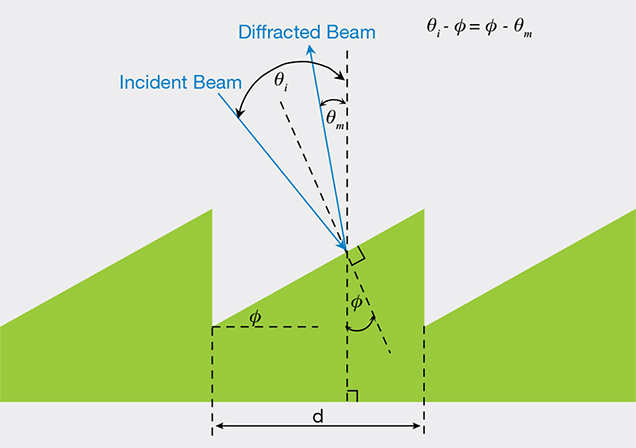
In the construction shown in figure 3, the mathematical equation that governs diffraction from blazed gratings is dependent on the steepness of the blaze angle between the inclined surface and the grating plane (labeled φ in figure 3), the distance between grooves (d in figure 3), and the angles (θi and θm) that the incident and reflected waves make with respect to the normals to the grating plane (Laufer, 1996). The condition for constructive interference is mathematically expressed as

where m is an integer that represents the so-called diffraction order. For a given angle θi, only a single wavelength of light satisfies this equation for first-order diffraction (where m = 1). Thus, as the incident light angle changes, the diffracted wavelength also changes, generating iridescence. The equations that govern the conditions for transmissive diffraction through repetitive substructures, as with iris agate, differ slightly from those that describe reflective iridescence, but they similarly define the conditions for constructive interference of emergent light waves (Kinoshita et al., 2008).
Mineralogical iridescence produced by intrinsic diffraction gratings is of particular interest because the substructures that create the gratings often yield insights into crystal growth processes. These in turn may allow geologists to quantify aspects of a mineral’s crystallization history, suggesting new pathways toward the self-assembly of hierarchically ordered structures. Four well-known examples of iridescence produced by repetitive transparent substructures are precious opal (Sanders, 1964; Darragh et al., 1966; Gaillou et al., 2008; Rondeau et al., 2010), labradorite (Nissen, 1971; McConnell, 1974; Cliff et al., 1976; Miura and Tomisako, 1978), moonstone (Akizuki and Sugawara, 1970), and iris agate (Taijing and Sunagawa, 1994; Heaney and Davis, 1995).
IRIDESCENT QUARTZ
Naturally iridescent quartz has been recognized for more than a century and is known by many names: iris quartz, rainbow quartz, schiller quartz, anandalite, and adularescent quartz. Petrov and Tanaka (2011) published online the only detailed review of the history of iridescent quartz. Although there is some ambiguity regarding the source locality for this material, most of the iridescent quartz on the market comes from India’s Deccan Traps in an area west of Burhanpur in Madhya Pradesh State, near the border with Maharashtra State. Indeed, the first known reference to iridescent quartz is the 1860 donation of an iris quartz cluster to the British Museum of Natural History by an engineer who worked on the construction of the Central India Railway. Iridescent quartz has also been reported from Washington State (USA), Uruguay, Brazil, Germany, Turkey, and Morocco (Gübelin and Koivula, 2005; Petrov and Tanaka, 2011; Renfro and Koivula, 2011).
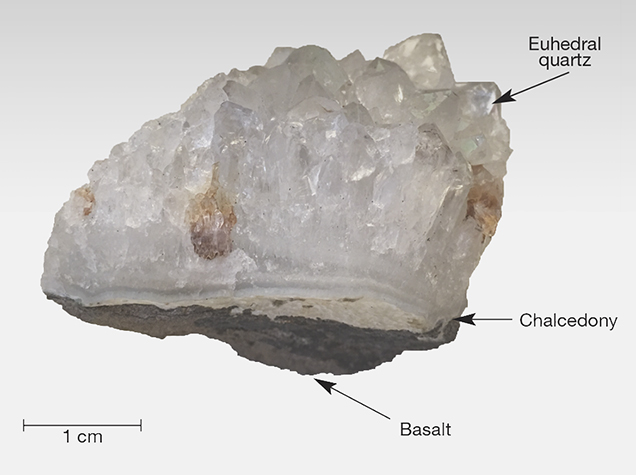
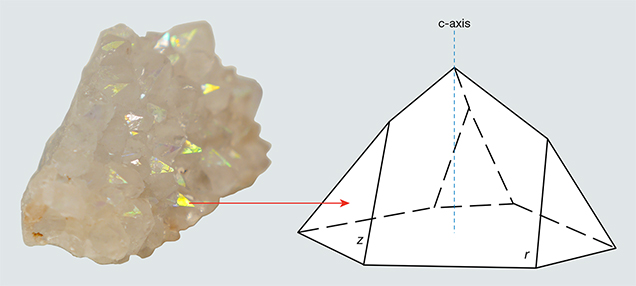
The iris quartz in the British Museum (number 55795) is described by vom Rath (1873) and Scharff (1875), and their descriptions precisely match the characteristics of the specimens examined in the present study (figure 4). These samples occur as clusters of euhedral quartz crystals that evidently filled gaseous vugs (open spaces) within the Deccan Trap basalts. At the base of these clusters is a rind of chalcedony, 0.2–0.4 cm thick, that abruptly transitions to quartz crystals, as is characteristic of many agate geodes. The quartz crystals exhibit strongly expressed terminal faces, and iridescence is visible only on the smaller z {011} faces and in zones closely surrounding them (figure 5), but not on the dominant r {101} faces. The spectral colors vary from red to blue depending on the angle of incident light and the viewing direction. Etch pits are commonly located on both the z and r faces, and iridescence is particularly strong within the etch pits on the z faces. Some crystals are broken, however, and rainbow colors are not visible in broken portions of otherwise iridescent z faces. The prismatic m {100} faces are poorly developed in these crystals. All of the single quartz crystals observed on this sample measure about 0.5–1 cm in length.
Until about 2009, one Japanese company controlled the market for iridescent quartz, importing several tons of material. Since that time, production from India has exceeded the importer’s capacity and the market has opened internationally (Petrov and Tanaka, 2011). Much of this quartz is of relatively low quality, but a small brilliant piece exhibiting strong colors can easily cost up to $2,000. In light of the growing market for iridescent quartz, specimens have been produced artificially through the deposition of thin films of various metals (as with “aurora quartz”). As a result, gem buyers have become skeptical of the authenticity of iridescent quartz from India. Nevertheless, Petrov and Tanaka (2011) reported that the Japanese gemologist Koichi Iida (Japanese Saitama Jewelry Institute) examined Indian iris quartz and confirmed that the iridescence is natural. In light of the historical record for this material, the natural origin of iridescent quartz from the Deccan Traps of India seems irrefutable.
C.V. Raman, the 1930 Nobel Laureate in physics, published the only scientific analysis of iridescent quartz we are aware of. Raman (1950) obtained specimens from a jeweler in Bombay and examined them using reflections of polarized light and visible light spectroscopy. He argued that the iridescence is not the result of a superficial film coating the quartz surface, as he observed the effect outside an iridescent face due to reflection within the crystal. Rather, he attributed the iridescence to “a layer of material which lies below the surface of the crystal and forms an integral part of its structure. The observations indicate the thickness of the layer to be of the order of a quarter of a millimeter.”
Based on his spectroscopic study, Raman concluded that the iridescence is caused by “a stratified medium consisting of a great many parallel layers of extreme thinness,” and he estimated that each layer was 0.34 μm thick (figure 6). He further hypothesized that the striations are regularly spaced polysynthetic Brazil twins oriented parallel to the minor rhombohedral z faces. Polysynthetic Brazil twins consist of alternating layers of right- and left-handed quartz, and they are particularly common in amethyst (Schlössin and Lang, 1965; McLaren et al., 1967; McLaren and Pitkethly, 1982; Baran et al., 1987; Schmetzer, 1987; Taijing and Sunagawa, 1990). Raman puzzled over the absence of iridescence in Brazil-twinned amethyst and recognized that the mere change in handedness at the twin boundary was insufficient to generate a schiller interference effect, as is seen in labradorite, since the RIs of Brazil twins are identical. Consequently, he speculated that the twin boundaries in the Indian iris quartz were associated with “extremely thin layers of impurity material.”
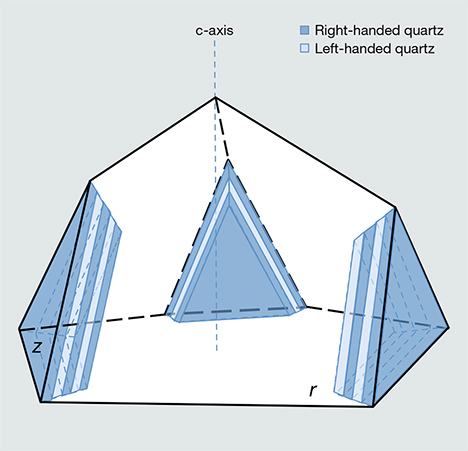
Raman was unable to confirm his deductions regarding the role that Brazil twins play in generating iris effects in quartz. Even though Brazil twin boundaries occur parallel to the {101} and {011} rhombohedral planes of quartz, studies of amethyst have determined that a specific Brazil twin boundary is never oriented parallel to a rhombohedral face with the same indices—in other words, the (101) face of quartz is not underlain by Brazil twin boundaries parallel to (101) (Balakirev et al., 1975). This observation contradicts Raman’s model of lamellar twin boundaries parallel to the iridescent crystal faces (figure 6). In the absence of a follow-up to Raman’s work, many members of the gem community have presumed that iridescence in these quartz crystals arises from a thin film of opal coating the surface (based on our discussions with collectors).
Using more sophisticated analytical techniques than Raman had at his disposal, we sought to determine the cause of iridescence in quartz crystals from the Deccan Traps. For our investigation, we employed a combination of scanning electron microscopy (SEM), atomic force microscopy (AFM), focused ion beam (FIB) milling, and transmission electron microscopy (TEM).
MATERIALS AND METHODS
Specimens. We purchased two specimens of iris quartz clusters from Georges Claeys (Geonic Mineralen Collectie, Mariakerke, Belgium) at the 2014 Tucson Gem and Mineral Show. Figures 4 and 5 show the same specimen from different angles. Mr. Claeys reported that he obtained the specimens from a dealer who collected them from the Jalgaon District of India. The physical properties of the two specimens precisely match the descriptions of other iris quartz clusters from this locality, and we feel confident of its provenance.
Scanning Electron Microscopy and Energy Dispersive Spectroscopy. All analytical testing was performed at Pennsylvania State University’s Materials Characterization Laboratory. For the first stage of our study, we used an FEI Quanta 200 environmental scanning electron microscope to map the surface topography of both iridescent and non-iridescent pyramidal faces of iris quartz. Selected quartz crystals were pried from the cluster, cleaned in methanol, and attached to a standard scanning electron microscope aluminum mounting stub with double-sided carbon tape. Because quartz is not conductive and was not coated by carbon, SEM images were taken at low vacuum with an accelerating voltage of 20 kV. An Oxford Instruments INCA x-act (Model 51-ADD0001) EDS detector on the microscope was used for surface chemical analysis. EDS data were analyzed using Oxford Instruments’ AZtec nanoanalysis software (version 2.4). We used three different accelerating voltages (20, 10, and 5 kv) to acquire spectra for the same sites.
Atomic Force Microscopy. We next employed AFM to construct high-resolution three-dimensional topographic maps of the pyramidal faces. By rastering a probe across the sample’s surface, AFM can reveal surface structure at the nanoscale. We removed two quartz single crystals from the cluster and oriented one iridescent face and one non-iridescent face parallel to the flat stage in the AFM. A PeakForce Tapping model with ScanAsyst was used for these surface measurements. The peak force set point ranged from 2.5 to 7.5 nN for AFM imaging, and the scan rate was 1 to 0.5 Hz. The AFM probe used in these analyses was a Bruker ScanAsyst-Air probe, which has a silicon tip on a nitride lever. The front angle of the tip was 15°, and the back angle was 25°. The data were collected as line scans with 512 points per line, with 256 lines collected in total. NanoScope Analysis software (version 1.50) was used to process the AFM data, and the average distance between two adjacent ridges was calculated through a fast Fourier transform (FFT) algorithm using MATLAB (MathWorks, Inc).
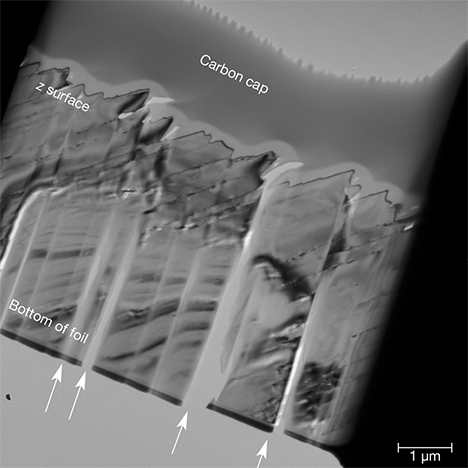
Focused Ion Beam Milling and Transmission Electron Microscopy. To ascertain any relationship between iridescent behavior and Brazil twinning, we prepared an electron-transparent mineral section, or foil, for TEM using focused ion beam lift-out (Heaney et al., 2001). Focused ion beam milling was performed with an FEI Helios NanoLab 660 FIB. A single quartz crystal was removed from a cluster and coated with conductive carbon paint to avoid charging. After the sample was mounted within the FIB, an amorphous carbon strap was deposited over the area of extraction to protect the foil and preserve the surface structure during the milling process (figure 7). A Ga+ ion beam was used to excavate the material on both sides of the foil. The initial Ga beam voltage of 30 kV was reduced to 5 kV and then 2 kV for the final thinning. Beam currents operated at 0.23 nA for the amorphous carbon deposition, 21 nA and 9.3 nA for intermediate milling stages, and finally 2.5 nA for milling prior to foil lift-out.

Next, the foil was soldered to a glass probe tip and deposited onto a V-shaped TEM half-grid post. Milling the sample on the grid began with a 30 kV ion beam with the stage tilted to 53.5°. As an angle of 52° is normal to the ion beam, this yielded an over-tilt of 1.5°. The over-tilt was increased to 3.5° for 5 kV milling, and finally to 5.0° for 2 kV milling. The thickness of the final foil was less than 100 nm to allow electron transparency, and the area of the quartz foil was approximately 7 μm × 4.5 μm. The entire milling and extraction process was monitored by secondary electron imaging. The milled sample was loaded in a Philips double-tilt holder with a Be stage and examined using a Philips 420 TEM at 120 kV.
RESULTS
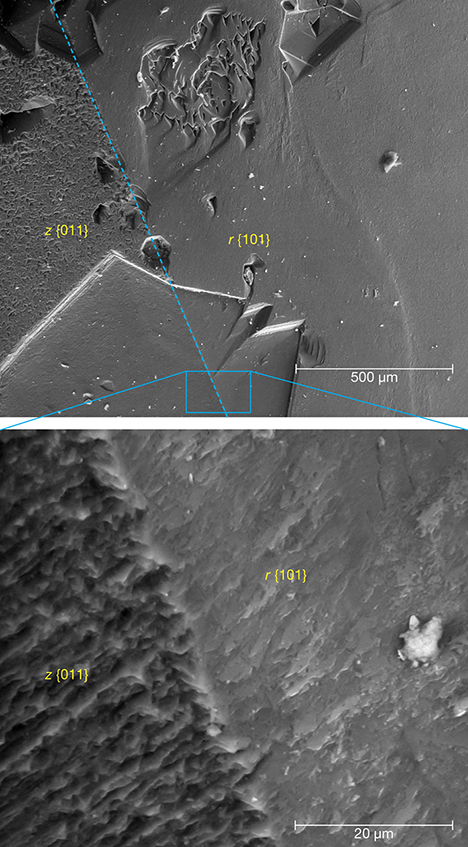
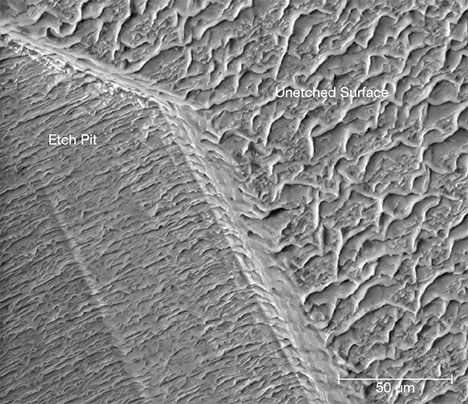
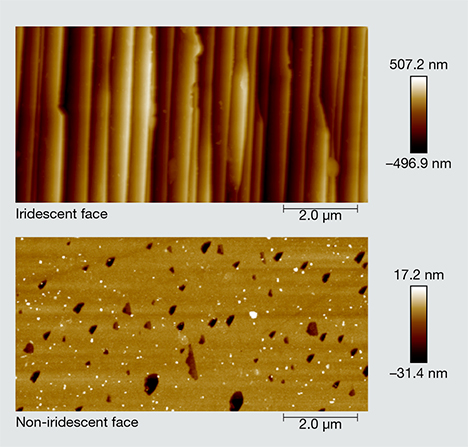
Surface Morphology and Composition. Topographic differences between the iridescent z and the non-iridescent r faces were apparent in SEM images of the crystals (figure 8). In particular, a high-magnification backscattered electron (BSE) image of an apparent etch pit across both faces revealed that the iridescent z face features parallel ridge-and-valley structures (figure 8, bottom), whereas the non-iridescent face was relatively flat and smooth. The SEM images suggested that the average distances between adjacent ridges fell below a micron, but AFM analysis (see below) allowed for more rigorous quantification. Although the striations were more pronounced in the apparent etch pits, an examination of the unetched surfaces of the z faces also revealed a substructure that consisted of alternating lamellae (figure 9).
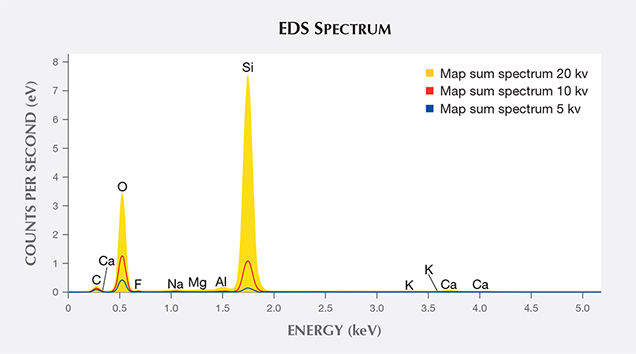
Compositional analyses on the iridescent faces obtained by EDS offered little evidence of a thin-film coating that might be responsible for the iridescence (figure 10). Trace amounts of Na, Al, and Ca were detected, but these elements were present in equal amounts on the iridescent and non-iridescent faces. Al commonly substitutes for Si in natural quartz (Heaney, 1994).
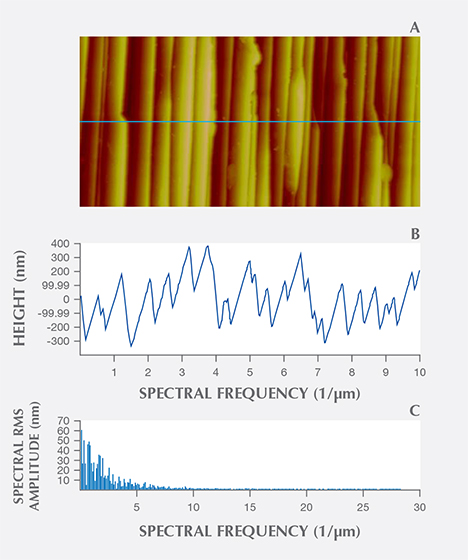
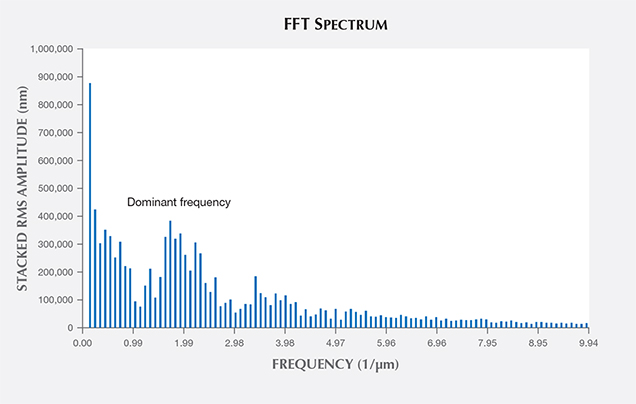
AFM confirmed the existence of distinctly periodic ridge-and-valley structures on the iridescent z faces and the absence of such surface modulations on the non-iridescent r faces (figure 11). The ridges were oriented parallel to the edge between the m and z faces. We calculated an average distance between adjacent ridges by processing the AFM images through an FFT algorithm using MATLAB. As the ridge shapes were not identical from top to bottom, we sliced the images into 256 cross sections from the top down (figures 12A and 12B), performing FFT on each section (figure 12C), and stacked the 256 FFT results to extract the most dominant frequency of ridge oscillation. The results of our FFT calculations are shown in figure 13. The first few high-amplitude peaks were caused by signal leakage in the FFT and should be ignored. The most dominant frequencies that reflect the wavelengths of the surface modulations ranged from 1.59 to 2.29 μm–1. Therefore, the real-space wavelength of the oscillation was on the order of 437 to 629 nm. These distances fall within the range of visible-light wavelengths, explaining the effectiveness of the substructure as a diffraction grating for visible light. These values are impressively close to Raman’s 1950 estimate of 0.34 μm (340 nm) for the periodicity of the iris quartz striations.
TEM Characterization. Using FIB milling, we extracted a thin foil from an iridescent z face; the foil was oriented perpendicular to the grooved surface striations (figure 7). Brightfield TEM imaging of the foil revealed the surface valley-and-ridge structure documented by SEM and AFM very clearly beneath the protective carbon cap (figure 14). Two varieties of defect structures associated with the surface ridges are evident in these images. First, corridors of missing material can be observed oriented normal to the ridged surface of the foil (arrowed in figure 14). As striking as these features are, they are not meaningful, because they were produced artificially during the sample preparation process. It is commonly observed that when solids with uneven surfaces are sputter milled by the focused ion beam technique, the Ga ions are channeled by the valley structures downward into the specimen during milling (Volkert and Minor, 2007). As a result, the section is selectively scoured along distinct channels, leading to the uneven excavation of material in parallel rows. This undesirable artifact creates an appearance of parallel slats within the foil.
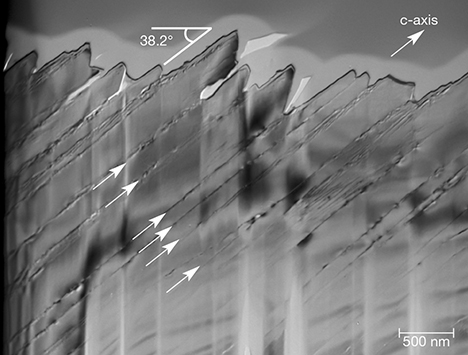
The second set of visible defect features is structurally more significant. A higher-magnification image of the foil (figure 15) shows that the slopes of the surface ridges are inclined ~38° from the top surface of the foil, which corresponds to the z (011) plane of the original crystal. Parallel line defects extend from the inclined ridges at the top of the foil through to the bottom of the section (arrowed in figure 15). We interpret these defects as traces of defect planes oriented parallel to the m (010) face of the quartz crystal. The calculated angle between m (010) and z (011) for quartz is 38.2°, consistent with the inclination observed in figure 15. The defects generally run parallel to each other, but in places near the surface they create vein-like networks. Micropores measuring tens of nanometers in diameter can also be seen as material gaps along the defects.
DISCUSSION
Cause of Iridescence. Our SEM and AFM images revealed that the z faces of iris quartz are marked by a topographic valley-and-ridge structure with remarkably regular intervals. The ridges were inclined from the z (011) surface at an angle of 38°, and the distance from the top to the bottom of the grooving ranged from approximately 100 to 600 nm. Fourier analysis of the AFM images placed the periodicity within the range of visible light, between 437 and 629 nm. That magnitude is consistent with the spacing between the inclined planar defects observed in brightfield TEM images. Electron diffraction patterns from the foil revealed only quartz, with no evidence of an opaline phase.
Consequently, it seems clear that the iridescence observed on the z faces of quartz from the Deccan Traps of India is caused by a combination of the surface grooving with an effective blaze angle of 38.2° and an underlying lamellar structure, which together create a diffraction grating for visible light. The absence of either opal or compositional impurities definitively rules out iridescence by a thin-film effect, sensu stricto. In addition, our observation contradicts Raman’s 1950 model for iridescence insofar as the planar lamellae we observed were oriented parallel to m {010} rather than z {011}. On the other hand, we did find some support for Raman’s interpretation that diffraction arises from a surface layer of the quartz crystals. After noting that broken z surfaces were not iridescent, we polished iridescent faces with a diamond polishing compound (8 μm grit) to see whether the iridescence could be eliminated by abrasion. In fact, the iridescence at first intensified and then disappeared. Although our study could not quantitatively constrain the depth of the diffracting layer, we estimate the thickness of the stratified medium as less than 500 μm but greater than the 5 μm depth of our FIB TEM foil, consistent with Raman’s estimate of 250 μm.
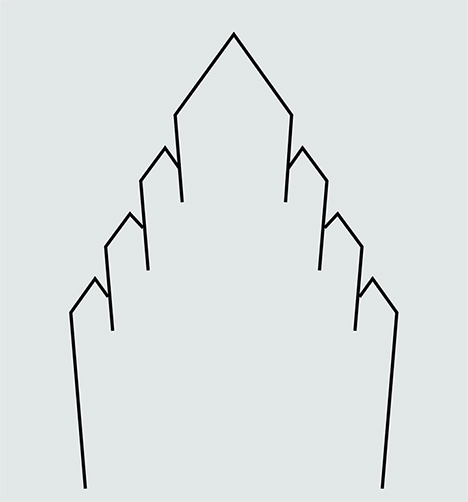
Origin of the Periodic Substructure. We pose two models for the existence of the repetitive structures that create the diffraction grating. One possibility is that the lamellae observed in figure 15 represent subdivided growth faces of quartz. Quartz is known to grow with “artichoke” or “cathedral” morphologies (figure 16) that involve the emergence of split, layered crystals from the rhombohedral faces of a parent crystal. The cause of the phenomenon is not known, but it may result from the poisoning of growth faces by impurities, leading to the division of the rhombohedral faces into multiple members, whose c-axes point roughly in the same direction.
Although we initially favored this genetic mechanism, we have subsequently grown skeptical of it. The artichoke morphology has been described for macroscopic crystals with layered outgrowths that are several millimeters in thickness. We know of no analogue for the nanoscale periodicity displayed by the iris quartz crystals from the Jalgaon District. Moreover, it is not clear to us how an undulating surface topography might emerge on the z faces and not the r faces of quartz during crystal growth. If the quartz druses grew in response to pulses of silica-rich fluids into the basaltic cavities of the Deccan Traps, then periodic growth behavior might be attributed to pulsing of the fluids, but episodic infusions of fluids would seem more likely to produce growth layers stacked normal to the z and r faces, which was not observed.
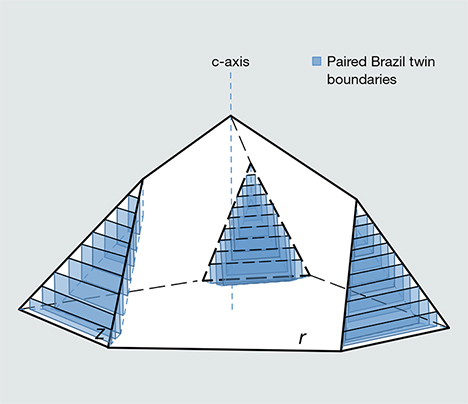
The second and more plausible explanation attributes the observed microstructures to polysynthetic Brazil twinning, as Raman (1950) originally speculated, but with a few departures from his original model. Whereas Raman proposed that Brazil twins were stacked parallel to the z faces and contained impurities at the twin boundaries, we argue that the Brazil twin boundaries occur as pairs, that they are oriented parallel to m {010}, and that diffraction of light occurs at the twin boundaries as the result of etching by aqueous fluids along the boundaries.
We base this interpretation on the observation that when one traces the planar defects along the FIB TEM foil from the surface of the crystal toward the interior, the slightly curved and wandering defect traces grade into strictly flat planar defects. Those defect planes occur as paired boundaries separated by ~30 nm (figure 17). Bragg thickness contours crossed these boundaries without interruption, and diffraction patterns that include these regions appeared as single-crystal patterns. Consequently, we found no evidence that these intergrowths represent exsolution lamellae or intergrowths of another phase, and we conclude that they are paired twin boundaries. The two most common twins in quartz are the Dauphiné and the Brazil twins, and it is notoriously difficult to distinguish between these by diffraction methods (Heaney, 1994).
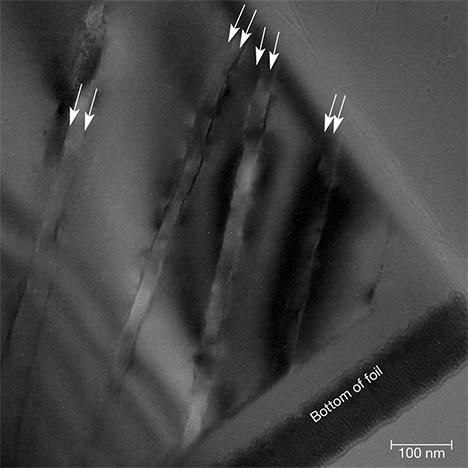
McLaren and Phakey (1965, 1966) demonstrated that interference fringes can be observed in brightfield and darkfield TEM images across Brazil twin boundaries. We examined a TEM foil from a Brazilian amethyst (Smithsonian National Museum of Natural History, USNM #R1453) to confirm the appearance of these fringes under the imaging conditions we applied to the Indian iris quartz, and the fringes were immediately apparent. We saw no such fringes during our examination of the parallel defect planes in the iris quartz from Jalgaon. That might weigh against an interpretation of these features as Brazil twins, but we are unaware of Dauphiné twins occurring as polysynthetic, nanoscale intergrowths except when crystals are heated to the transition temperature between low and high quartz (573°C; van Tendeloo et al., 1976). Moreover, interference fringes are not expected at Brazil twin boundaries when the TEM section of quartz is oriented exactly perpendicular to the twin boundary—the electron beam from one twin member does not interfere with that of the other, as happens when the twin walls are oblique to the surface of the TEM foil.
McLaren (1967) reported an absence of telltale Brazil twin fringes in his TEM analysis of quartz crystals exposed to a shear deformation parallel to (001). Deformation generated paired Brazil twin boundaries approximately 30 nm apart, and these boundary pairs were themselves separated by hundreds of nanometers. Brightfield images from TEM foils cut normal to the twins exhibited no fringe interference. The defect structures described by McLaren (1967) are virtually identical to those we characterized for the Indian iris quartz. Although we do not suggest that the quartz druses from the Deccan Traps were exposed to deformational shear, we speculate that another process (possibly incorporation of Al or rapid growth rates) may have generated periodic paired Brazil twin boundaries oriented parallel to m {010}.
It is well known that twin boundaries in minerals are vulnerable to preferential weathering (e.g., Cornell et al., 1974; Wilson and McHardy, 1980; Cornell and Giovanoli, 1988). The paired Brazil twin boundaries in iris quartz is proposed by us to represent strained regions that were particularly susceptible to dissolution, and we suggest that post-growth episodes of etching by invasive fluids preferentially altered the paired Brazil twin boundaries where they intersected the surface z faces, sculpting the valley-and-ridge topography we observed. Moreover, the channeling of these fluids along the twin boundaries within the crystal resulted in dissolution and recrystallization of the twin boundaries, producing both fluid-filled nanopores and the vein-like defect surfaces observed near the top of our TEM foil.
Consequently, we interpret the diffraction effect as a result of surface etching and subsurface alteration by post-depositional fluids. The iridescence thus represents a combined effect of reflective interference from the grooved surface and transmissive interference at the weathered twin boundaries just below the surface (figure 17). When the etched surface layer is removed, as on the naturally fragmented and the artificially polished z faces, then the iridescence disappears. Thus, the depth of the iridescence effect traces the reach of aqueous alteration, not the interior extent of the twinning. In turn, this observation explains why iris quartz crystals occur globally yet remain elusive to collectors. Many quartz crystals—particularly amethysts—are extensively twinned according to the Brazil law and contain periodic defects separated by distances close to the wavelengths of visible light. But it is only when these crystals have experienced a subsequent stage of dissolution, with differential etching along the defect planes (figure 18), that they will transform to iris quartz.
In “To the Rainbow,” the Scottish poet Joanna Baillie (1762–1851) lamented the fate of natural wonders when their magic is reduced to empirical hypotheses:
When science from creation’s face
Enchantment’s veil withdraws,
What lovely visions yield their place
To cold material laws!
As C.V. Raman understood, the search for an explanation of rainbows in gem materials is not simply an exercise to recast a beautiful phenomenon as a mathematical equation. Gem rainbows can appear when crystal structures invisible to the unaided eye are arrayed in repetitive patterns that will diffract light. Thus, modern scientific analysis withdraws enchantment’s veil only to yield new enchantments.


