Characteristics of Gem-Quality By-Product Synthetic Zincite
ABSTRACT
Gem-quality synthetic zincite from Poland, an industrial by-product of zinc oxide processing, has been available in the market since the early 1980s. In this investigation, conventional gemological methods, spectroscopic techniques, and advanced analytical testing were carried out on 10 rough and faceted samples. The chromophore manganese (Mn), which is significant in natural zincite and can reach 1 wt.% MnO, appears to be negligible in by-product crystals. These crystals also appear to have low to insignificant levels of other potential chromophores such as iron and copper. Inclusions matching previously reported oval and “tadpole-like” inclusions in Polish synthetic zincite were observed and tested by Raman and IR spectroscopy. These inclusions were identified as carbon-bearing material, possibly belonging to soot and/or gases captured during the growth of the synthetic zincite host.
INTRODUCTION
Zincite (ZnO) was discovered in 1810 (Dunn, 1995; Welch, 2008) and mined from marble-hosted Zn-Fe-Mn skarn-type deposits (Hague et al., 1956; Webster, 1983) at the Franklin and Sterling Hill mines of Sussex County, New Jersey. These mines are still considered the only locality for gem-quality natural zincite (Dunn, 1995; Peck et al., 2009; Wilson, 2013). The natural zincites were always aggregates, both massive and small (Nowak et al., 2007). Only a few large gem-quality crystals displaying strong luster and a beautiful bright red color have been faceted (Welch, 2008). Some collectors seek the stone for its rarity and attractive appearance, although a relatively low hardness (4 on the Mohs scale) limits its use in jewelry (Henderson, 1945; Nowak et al., 2007; Wilson, 2013).
Zincite is also an important semiconductor material, doped by impurity elements to enhance its physical properties in applications such as photodetectors (Soci et al., 2007), LED lights (Dong et al., 2007), laser diodes (Liang et al., 2010), transparent transistors, and substrates (Gahtar et al., 2013). The wide-ranging industrial applications of ZnO have driven crystal growth efforts. Zincite crystals have been synthesized in labs through vapor deposition (Pasko et al., 1976), hydrothermal methods (Karipidis et al., 2008), and pressurized melt growth methods (Nause and Nemeth, 2005). Yet there have been no reports of any effort to pursue synthetic gem crystal growth. Crystals grown by vapor deposition often appear one-dimensional, needle-like, or columnar due to rapid growth along the c-axis (Pasko et al., 1976). Hydrothermal crystals display a two-dimensional plate-like appearance because of the seed orientation (Kortounova et al., 2001; Karipidis et al., 2008), and pressurized melt growth normally produces round boules (Nause and Nemeth, 2005).
During the 1980s, a new form of synthetic zincite emerged from an unnamed foundry in Poland’s Lower Silesia Province (Crowningshield, 1985; Kammerling and Johnson, 1995). This material grew as an industrial by-product in the chimney vents of industrial kilns producing zinc oxide powder, through a process similar to chemical vapor deposition (Nowak et al., 2007). We will refer to it as “by-product zincite” hereafter. These crystals possess better transparency and brighter color than natural zincite. By-product zincites were sold in the jewelry market from the early 1980s until the 2000s, but now they can only be acquired from existing stocks (Kammerling and Johnson, 1995; Nowak et al., 2007).
The properties and formation processes of by-product synthetic zincite crystals from the Olawa foundry in Lower Silesia have previously been studied (e.g., Crowningshield, 1985; Kammerling and Johnson, 1995; Nowak et al., 2007). Insights into their color and the nature of their unusual oval or “tadpole-like” inclusions (Nowak et al., 2007) have remained elusive. In this investigation, rough by-product zincite crystal samples from the foundry in Lower Silesia were chosen for standard gemological observations, elemental analysis by X-ray fluorescence (XRF) and inductively coupled plasma–mass spectrometry (ICP-MS), and spectroscopic analysis in order to find the characteristics that distinguish them from natural material, identify their inclusion features, and provide an explanation for the cause of color.
MATERIALS AND METHODS
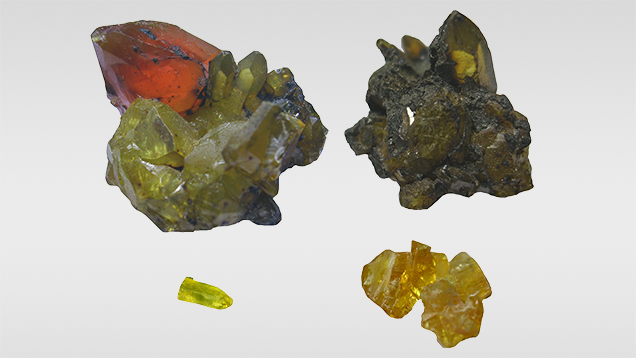
Figure 1 shows four of the 10 rough by-product zincite crystal samples (0.34–13.85 g) that were analyzed. Two were faceted by author YG (labeled Zincite-L and Zincite-S). Sample zin-10 is a group of five unprocessed rough fragments from a yellow crystal; the remainder of this crystal is the faceted sample Zincite-S. All rough samples were purchased at the Warsaw Mineral Show in September 2010; the seller claimed they were produced at an undisclosed foundry in Lower Silesia, Poland.
Standard gemological testing, visible spectroscopy, and Fourier-transform infrared (FTIR) spectroscopy were performed at the School of Gemology, China University of Geosciences in Beijing (CUGB). Visible spectra of samples Zincite-L, Zincite-S, and ZnO-G were recorded using a LabTech UV-Vis spectrophotometer in the 400–700 nm range with a sampling interval of 1 nm at a rate of 600 nm/min. Mid-infrared (4000–400 cm–1) spectra of rough sample zin-10 were obtained with a Bruker Tensor 27 FTIR spectrophotometer, operating in absorption and reflectance modes with a resolution of 4 cm–1 and 50 scans per sample at room temperature using the KBr pellet method (100 mg KBr and 1.0 mg sample).
XRF results for nine samples (ZnO-LC, Zincite-L, Zincite-S, zin-10, ZnO-G, zin-fs, zin-fc, zin-7, and zin-8) were tested at the Shanghai laboratory of the National Gemstone Testing Center (NGTC), using a Shimadzu EDX-7000 from 11Na to 92U with a 3 mm collimator and a two-minute testing time.
ICP-MS of five samples (ZnO-LC, Zincite-L, Zincite-S, three specimens of the zin-10 group, and ZnO-G) was conducted at Key Laboratory of Submarine Geosciences of the Second Institute of Oceanography, State Oceanic Administration in Hangzhou, using an Elan DRC-e ICP-MS with the U.S. Geological Survey (USGS) standard BHVO-2 measured to monitor accuracy. Small quantities of the five samples were ground into a powder and sieved to obtain a 200 mesh size. Aqueous solutions of the powders were created by dilution of solutions of the powders created using first aqua regia in a Teflon bomb with heating followed by HClO4 and HNO3 in a Teflon bomb with heating. The unit of ICP-MS results was ppmw; detection limits for all elements were lower than 4 ppmw.
Raman spectroscopy was performed at the Chinese Academy of Geological Sciences (CAGS) in Beijing. Six samples (Zincite-L, Zincite-S, ZnO-LC, ZnO-SC, zin-fs, and zin-fc) were analyzed using a Renishaw 2000 laser Raman microspectroscopy system with an argon-ion laser (514.5 nm excitation), 20 mW power, minimum spot size of 1 μm, and spectral resolution of 1–2 cm–1. The oval inclusion in Zincite-S and another unidentified inclusion belonging to zin-fc were also analyzed in situ by Raman spectroscopy.
We compared our results with the Raman spectra and chemical data of two previously tested natural red zincite samples (R050419 and R050492) from the RRUFF database (http://rruff.info). Sample R050419 is a deep red crystal from the Sterling Hill mine, and sample R050492 is a massive deep red crystal from the Franklin mine. No natural zincite was examined in this study due to the difficulty of obtaining such material.
RESULTS AND DISCUSSION
Crystallography and Gemological Properties. The by-product crystals exhibited a hexagonal prismatic and pyramid appearance, consisting of hexagonal prism m {1010}, hexagonal pyramids t {1124} and p {1011}, and single face c {0001} (figure 2), with contact twinning along (0001) following wurtzite structure (Zhao et al., 2006). The samples’ colors ranged from reddish orange to yellow to greenish yellow, and all of them were transparent, with a subadamantine to vitreous luster (figures 1 and 3). Their RIs were over the limit of the refractometer (RI = 1.78). With a handheld spectroscope, absorption bands were only seen in the blue to violet regions. The samples’ specific gravity, measured hydrostatically, ranged from 5.66 to 5.70. These properties were consistent with previous reports (Crowningshield, 1985; Kammerling and Johnson, 1995; Nowak et al., 2007).


Chemical Composition. XRF testing suggested that the samples were composed of almost pure zinc and oxygen. To investigate the potential chromophores of by-product zincite, the powders of five samples were tested by ICP-MS. The results showed that Mn levels were negligible, ranging from 1.53 to 7.55 ppm with a mean of 3.38 ppm, corresponding to previous reports (Kammerling and Johnson, 1995; Nowak et al., 2007). These levels were all dramatically lower than Mn contents in natural material (approximately 1 wt.% MnO; see Webster, 1983; http://ruff.info). Iron contents in by-product samples were relatively high among nine potential chromophores, ranging from 38.31 to 104.92 ppmw with a mean of 68.74 ppm; the contents of other elements were lower than 30 ppmw (table 1; figure 4).
| TABLE 1. Chemical composition of potential chromophore elements of by-product synthetic zincite tested by ICP-MS (in ppmw). | |||||
| ZnO-LC (orange-red) |
Zincite-L (reddish orange) |
Zincite-S (yellow) |
zin-10 (yellow) |
ZnO-G (yellowish green) |
|
| Ti | 8.3 | 10.8 | 5.8 | 0.0 | 0.8 |
| V | 0.2 | 1.4 | 5.2 | 1.4 | 0.7 |
| Cr | 1.6 | 3.8 | 7.7 | 11.0 | 2.3 |
| Mn | 1.8 | 1.6 | 4.3 | 7.5 | 1.5 |
| Fe | 63.3 | 51.0 | 104.9 | 86.2 | 38.3 |
| Co | 0.7 | 0.7 | 1.9 | 0.6 | 0.7 |
| Ni | 9.2 | 6.1 | 19.7 | 6.1 | 10.8 |
| Cu | 16.1 | 6.8 | 29.1 | 6.9 | 9.3 |
| Cd | bdl | bdl | bdl | bdl | bdl |
|
Sample detection limits (ppmw) were Ti (0.336), V (0.058), Cr (0.245), Mn (0.014), Fe (3.383), Co (0.007), Ni (0.023), Cu (0.020), and Cd (0.021).bdl = below detection limit
|
|||||

Visible Spectra and Cause of Color. The visible spectrum of reddish orange Zincite-L displayed a wide absorption band from 550 to 400 nm, covering the green to violet regions (figure 5). Yellow Zincite-S revealed a broad absorption band between 480 and 420 nm in the blue to violet region, while yellowish green ZnO-G absorbed only violet light from 450 to 400 nm (figure 6).
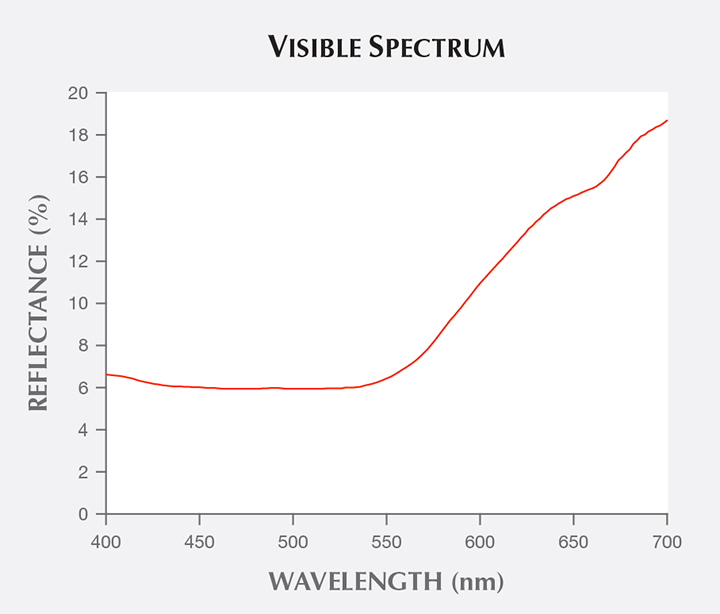

There is no clear relationship between the material’s color and its chemical composition, and the contents of potential chromophore elements were low, although the yellow samples had relatively higher Fe contents than orange to red or yellowish green samples (again, see table 1 and figure 4). The cause of various colors observed may be related to structure rather than chemical composition. These structural factors include increasing amounts of band gap absorption from defect states (Kammerling and Johnson, 1995), lattice defects with electron donors such as neutral zinc atoms (Nowak et al., 2007), and either oxygen deficit or zinc excess within zincite (Mikami et al., 2005; Karipidis et al., 2008).
Raman Spectra. Raman spectra were obtained from sample Zincite-L with its c-axis oriented parallel and perpendicular to the laser beam, together with five other samples (Zincite-S, ZnO-LC, ZnO-SC, zin-fs, and zin-fc) whose c-axes were randomly oriented with respect to the laser. In addition, the spectra from two natural samples, taken from the RRUFF database, were analyzed. The unoriented Raman spectra were similar, so one representative spectrum of Zincite-S was chosen (figure 7). The Raman peaks of zincite were divided into three groups:
- Shared peaks in natural and by-product zincite spectra at approximately 331 and 437 cm–1
- Unique peaks in natural zincite spectra at about 477, 522, 568, 1065, and 1090 cm–1
- Unique peaks in by-product synthetic spectra at approximately 379, 410, 540, 580, 660, and 1150 cm–1
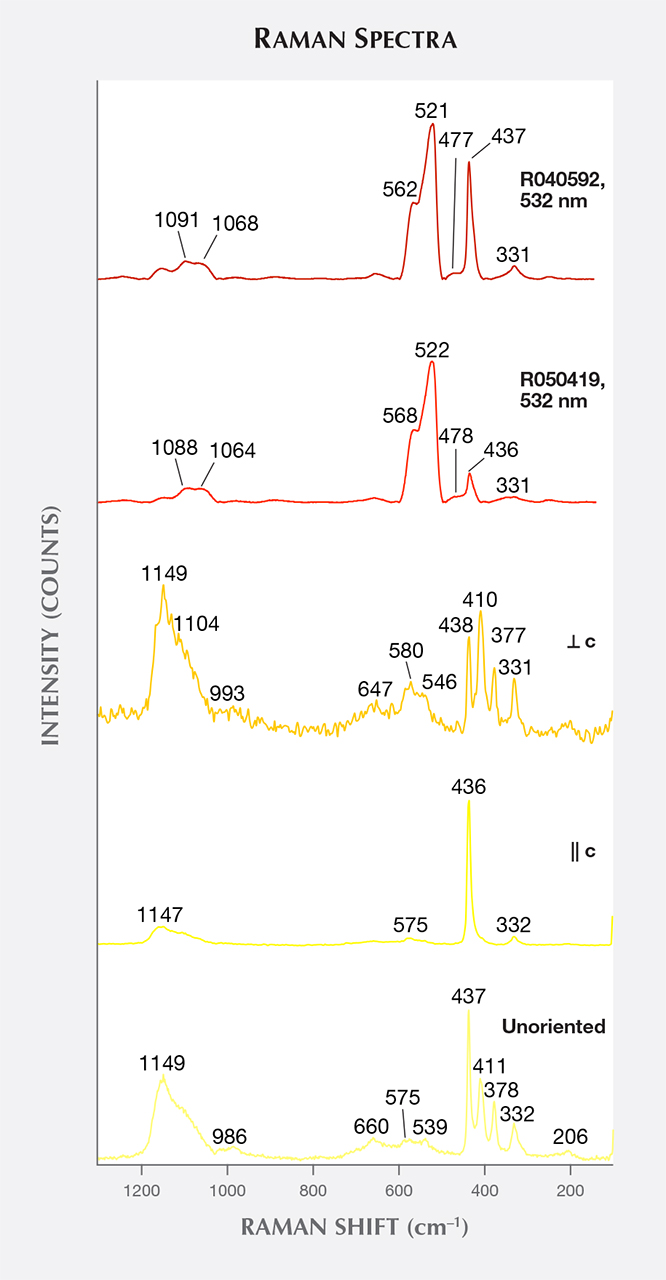
The latter two groups of peaks could serve to distinguish by-product zincite from natural zincite using Raman spectroscopy.
Oval Inclusion. Nowak et al. (2007) reported unusual oval and “tadpole-like inclusions” in Polish by-product synthetic zincite; in this study, two similar inclusions were observed and tested. The first oval inclusion, belonging to sample Zincite-S (figure 8), showed Raman peaks at 2938, 2923, 2882, 2854, 1613, 1546, 1507, 1442, and 1098 cm–1, which indicated some carbon-bearing material stretching modes (figure 9). The second inclusion, located at the cleavage plane of sample zin-fc (the figure was not obtained successfully due to the rough cleavage surface), displayed Raman peaks at 2929, 2882, 2850, 1613, 1580, 1430, 1392, 1346, 1296, and 1204 cm–1 (figure 10).
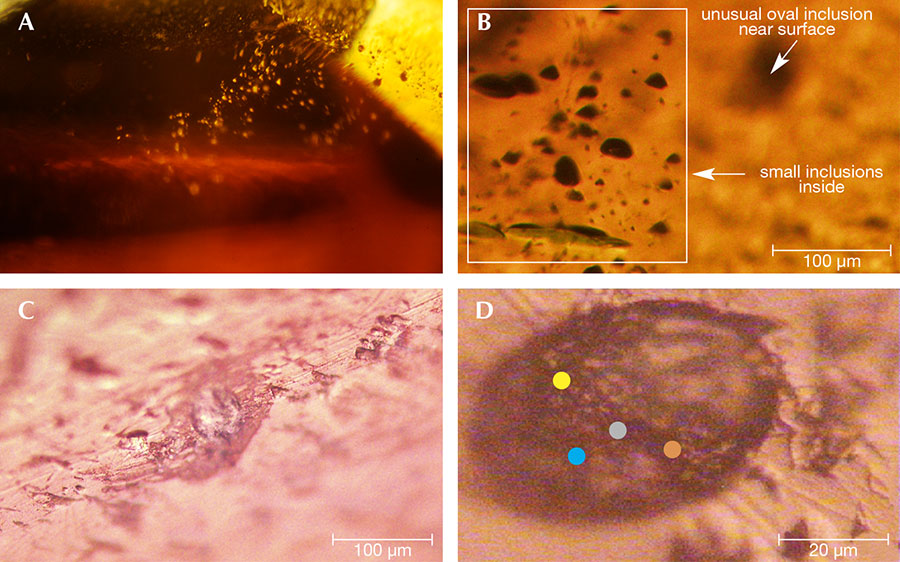

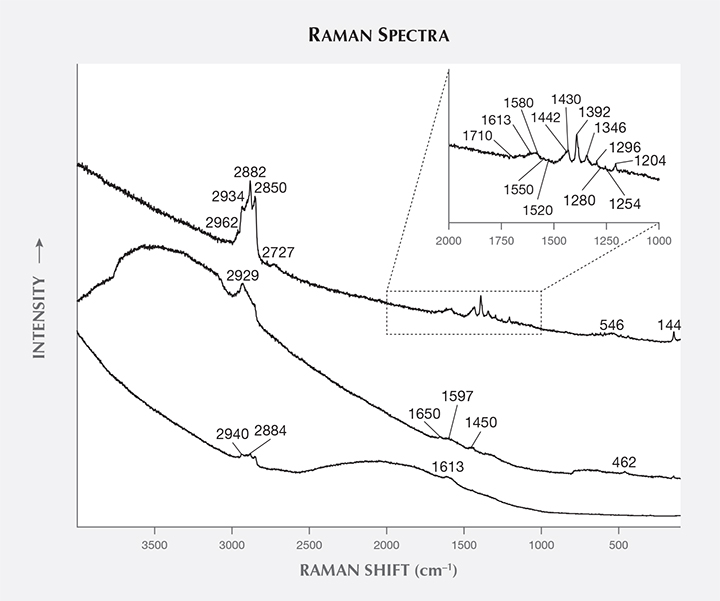
Combined with the C-H stretching mode indicated by the IR spectra of rough sample zin-10 (figure 11) and excluding the shellac used in the cutting process (whose Raman peaks are not a match), it is suggested that there are some carbon-bearing materials that make up the oval inclusions in the by-product synthetic zincite. Although the origin of the oval inclusion was not clear, possible sources include (1) a group of carbon-bearing gases such as CH4 and CO2 in the crystal formation atmosphere; and (2) the complex fuel ashes (carbon-bearing soot) produced by the smelting process (Nowak et al., 2007). On one hand, Raman spectra of individual gases (Dickinson and Rasetti, 1929) have one or two peaks near the peaks of the oval inclusion, such as the 1285 cm–1 peak of CO2 and the 2914 and 3022 cm–1 peaks of CH4. On the other hand, some peaks in the oval inclusion’s spectra are the same as or similar to the peaks in Raman spectra of soot (e.g., Ramya et al., 2013; Kim et al., 2005; Sadezky et al., 2005). These are at 1580 cm–1 (same as the G band of soot), 1346 cm–1 (near the 1350 cm–1 D1 band), 1507 cm–1 (near the 1500 cm–1 D3 band), 2800–2900 cm–1 (near the 2700, 2900, and 3100 cm–1 Lorentz-shaped bands), 1613 cm–1 (near 1620 cm–1), and 1204 cm–1 (near 1200 cm–1).

The Raman peaks of the oval inclusion more closely matched peaks of carbon-bearing soot than those of individual organic gases. Thus, the Raman results might be contributed mainly by soot and supported by some individual gases.
The oval inclusions reported by Nowak et al. (2007) and in this paper were quite different from the fluid inclusions, liquid film negative crystals, growth tubes, and cloud inclusions in natural zincite (Kawano, 2008). Although lab-grown synthetic zincite has not been reported for gemstone use, the oval inclusion composed of carbon-bearing materials (possibly soot and/or gases) might not occur in lab-grown zincite because of the accurately controlled original materials and reaction processes (Pasko et al., 1976; Nause and Nemeth, 2005; Karipidis et al., 2008).
CONCLUSIONS
The by-product synthetic zincite has much less manganese than natural zincite, and the causes of color of by-product synthetic and natural zincite crystals appear to be different. Besides Mn, the contents of other potential chromophores are also at levels low enough to indicate that the various colors of the by-product material may be affected by structure-related factors. Oval inclusions consistent with a previous report on by-product synthetic zincite were observed, and testing suggested they were soot and/or gases captured during the growth of host by-product synthetic zincite.


