An Introduction to Photoluminescence Spectroscopy for Diamond and Its Applications in Gemology
ABSTRACT
Photoluminescence (PL) spectroscopy is frequently mentioned in the gemological literature, but its relevance to the wider trade audience is rarely discussed. Due to the possibility of an undisclosed treatment or a synthetic origin, all type II diamonds (both colorless and fancy-color) and colorless type IaB diamonds submitted to gemological laboratories should ideally be tested using PL spectroscopy. Although the proportion of samples that require this testing is small, the failure to properly identify treated and synthetic diamonds could destabilize the diamond industry. This article seeks to clarify the underlying physics and methodology of this important tool for gemologists.
INTRODUCTION
Photoluminescence (PL) spectroscopy, as applied in gemology, is a nondestructive analytical technique in which a material is illuminated with light, usually from a laser, and the resulting luminescence is recorded as a plot of emitted light intensity versus wavelength. In the last decade, PL has become an essential tool used by major gemological laboratories to separate treated and synthetic diamonds from their natural counterparts (e.g., Breeding et al., 2010; Lim et al., 2010). Atomic-scale features (often termed optical centers, optical defects, or simply defects) occur within the diamond structure; examples include carbon, nitrogen, boron, and vacant carbon-atom locations in the lattice (i.e., vacancies). The configuration of these defects varies with the growth conditions and subsequent geological or treatment history. PL provides a very sensitive tool for detecting deviations in atomic configurations and defects even at concentrations of less than ten in a billion carbon atoms (Wotherspoon et al., 2003). Today, nearly all type II colorless to near-colorless and fancy-color diamonds require PL analysis for definitive characterization as natural, treated, or synthetic. Type IIa pink and type IIb blue natural diamonds, for instance, can be extremely valuable, commanding prices upward of $1 million per carat. The natural origin of such diamonds is often verified principally through features in their PL spectra (figure 1).
Treated and synthetic diamonds may each display distinctive visual features—graphitized inclusions, metallic inclusions, facet-related color zoning, graining patterns, or altered surfaces—that are visible under magnification. But these characteristics are not always present, or necessarily specific to treated, synthetic, or natural stones. Gemological laboratories often rely on absorption and luminescence spectroscopic techniques to conclusively identify diamonds submitted for examination (e.g., Collins et al., 2000; Collins, 2003; Shigley and Breeding, 2013). High-pressure, high-temperature (HPHT) treatment of diamonds for color enhancement has become increasingly widespread in the trade over the past several years; more recently this process has been combined with irradiation and annealing to produce an even wider range of desirable diamond colors. The combination of multiple treatments and the constant evolution of treatment and synthesis technologies present significant challenges for these laboratories (Schmetzer, 2010; Lim et al., 2010).
A diamond’s origin—whether it was mined from the earth or created in a lab—and subsequent treatment history can be a major factor in its value. PL analysis is a remarkable translator of each diamond’s story; its extremely sensitive detection of trace concentrations of defects is unmatched by other nondestructive characterization techniques. Therefore, PL analysis has become an integral part of the diamond grading process. While the number of diamonds that require PL testing is relatively small—approximately 2% of all diamonds are type II—these are often the largest or most highly valued stones.
Despite PL’s importance for diamond and other gemstone analysis, it is not widely available outside of gemological laboratories due to the relatively high costs of the equipment, maintenance, training, and specialized sample requirements. The necessary microscopes, lasers, and spectrometers that make up most PL systems together cost several hundred thousand dollars. Smaller desktop and portable units using a charge-coupled device (CCD) provide some of the important functionality of more expensive systems, but they are generally lacking in other areas, such as resolution (their ability to distinguish individual peaks). The PL features of defects in diamond also tend to be sharper, and thus appear more intense, at very cold temperatures. Consequently, spectra are usually collected with the diamond cooled to liquid nitrogen temperature (–196ºC). These requirements, along with the inherent danger of high-energy light sources such as lasers, introduce important safety considerations as well.
Most importantly, a diamond’s formation and color origin can be confirmed only when data are evaluated against information obtained from known natural, treated, and synthetic diamonds, so a database of such samples is vital. PL spectra also function in concert with other spectroscopic analyses (e.g., infrared and UV-Vis-NIR absorption), fluorescence imaging (namely the DiamondView), and gemological observations. Due to complex treatments and the evolution of synthetic diamond growth techniques, the accurate assessment of color origin is best left to fully equipped gemological laboratories. Nevertheless, members of the gem industry should have some understanding of the analytical techniques on which many color origin determinations are based.
Gemological journals such as this one regularly present PL spectra within scientific studies, but the underlying theory and data collection procedures are perhaps not well understood by the typical gemologist who relies on these articles for vital knowledge. This article is not intended as a comprehensive review of PL or the features scientists use to make an origin determination. Instead it seeks to explain, in somewhat simplified terms, what PL spectroscopy is; how it relates to other types of luminescence measurements such as fluorescence, phosphorescence, and Raman spectroscopy; and why it is important to gemologists. PL is most commonly used with diamond analysis, but it has some important applications for other gemstones as well, which are briefly mentioned at the end of this article and in table 1. Therefore, most of the technique information is also applicable for gems other than diamond (although they should not be cooled to liquid nitrogen temperatures). There are several excellent reviews of diamond spectroscopy that describe the various defects that occur in natural, synthetic, and treated diamonds (Collins, 2001, 2003; Zaitsev, 2003; Dischler, 2012; Dobrinets et al., 2013; Shigley and Breeding, 2013). We encourage the reader to consult these references for more information.
SPECTROSCOPY AND LUMINESCENCE THEORY
Spectroscopy can be defined as the branch of science concerned with the investigation and measurement of spectra produced when matter interacts with or emits electromagnetic radiation. These interactions are very useful for the analytical testing of gemstones because the energy of visible light or other types of radiation can closely match the energy difference of a wide variety of chemical bonds in minerals. The energy of the chemical bonds within diamond and many other gemstones is relatively constant. Over the past century, considerable research work has been done to identify the atomic configuration of spectral features. Consequently, spectroscopy is an accurate identification tool for a wide variety of gemstones. The high sensitivity of PL in particular allows for detection of many spectral peaks that are impossible to measure by other techniques, thus revealing important details about a stone’s history, such as growth or treatment.
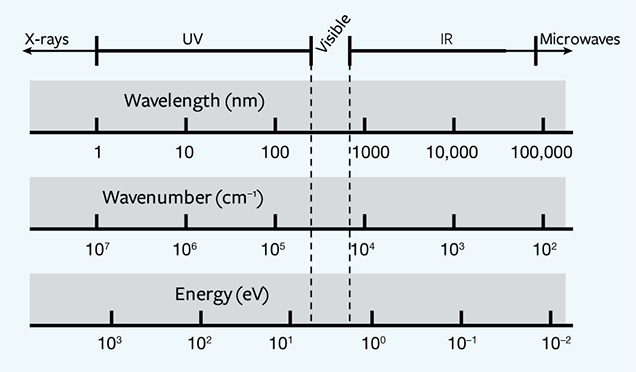
Luminescence, the emission of visible light, occurs when an energy source (laser, UV lamp, etc.) knocks an electron out of its stable “ground” state and elevates it to an “excited” state. As the electron returns to its normal ground state, energy is released, much of it in the form of visible light. In almost all cases, the emitted light is of a lower energy in the electromagnetic spectrum than the original light from the energy source. Since wavelength and energy are inversely proportional, a lower energy always translates to a higher wavelength. Therefore, PL spectra always encompass a wavelength range that is higher than the wavelength of the excitation source. The relationship between energy (in eV), wavelength (in nm), and wavenumber (in cm–1) is given by equation 1:

where E is the energy in units of eV, or electron volts, λ is the wavelength measured in nanometers (nm), and ν is the wavenumber, which has units of cm–1 and is the reciprocal of wavelength. The 1240 value derives from physical constants and conversion factors: h is Planck’s constant (6.6261 × 10⁻³⁴ joule-seconds), and c is the speed of light (2.9979 × 10⁸ meters/second); 1 eV converts to 1.6022 × 10⁻¹⁹ joules, and 1 nanometer converts to 1 × 10⁻⁹ m. Figure 2 shows the ranges of values for wavelength (in nm), wavenumber (in cm–1), and energy (in eV) from the ultraviolet through the infrared portion of the electromagnetic spectrum. With luminescence, there can be a variety of energy sources (UV lamp, laser, electron gun, X-ray), different pathways for the electron to return to the ground state (direct, or delayed by one or more intermediate states), and various conditions that affect the rate of the process (temperature, the presence of other defects, etc.). Figure 3 shows a chart of several types of luminescence and how they relate.
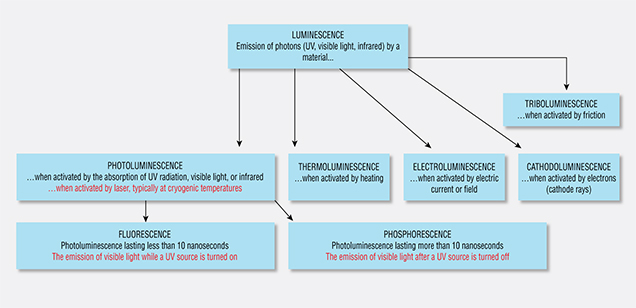
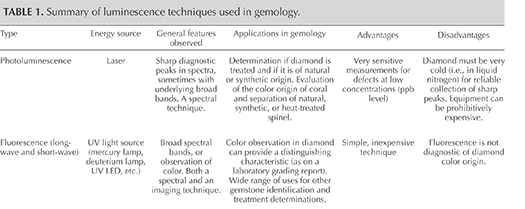
Within gemology, there are several measurement techniques that, as now practiced, differ from their given scientific definitions: phosphorescence, fluorescence, and photoluminescence, for example. In these cases, both the scientific definition and the de facto practice within gemology are provided. Table 1 summarizes several types of luminescence, some of which are important in gemology.
Optically Active Defects. Gemological laboratories rely on nondestructive analytical techniques for diamond that are based mainly on optical methods such as absorption and PL spectroscopy. Only defects that emit light (i.e., optically active defects) can be detected by PL, and these detections are further constrained by operating conditions such as temperature and excitation laser wavelength. These constraints often limit our knowledge about the full range of impurities and defects present in gemstones, forcing us to focus any assessments on information obtained principally from optically active defects.
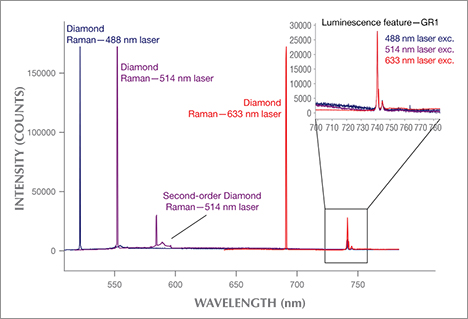
Fortunately, most impurities in diamond are optically active in some manner. For example, a pair of PL peaks at 736.6 and 736.9 nm (the SiV– doublet) indicates the presence of silicon impurities in diamond. These impurities are very rarely seen in natural diamond but typically occur in CVD synthetic diamond and thus assist in their identification (Breeding and Wang, 2008). Many well-known defects in diamond are various combinations of nitrogen impurities with vacancies in the lattice (such as N3, H2, H3, H4, and NV centers) and have been characterized extensively over the past decade (see recommended references in the introduction). Several other PL peaks occur in natural diamond and have been correlated with diamond color, type, or geographic origin, but the composition of the associated lattice defects has not been conclusively identified by scientists. Eaton-Magaña and Lu (2011), among others, correlated several PL peaks, such as those at 648.2 nm and 776.4 nm, with gray to blue color and boron concentration in phosphorescing type IIb diamonds. Later researchers ascribed the 648.2 nm defect to a boron-interstitial complex (Green, 2013), while the configuration of the 776.4 nm peak remains undefined.
To understand how luminescence techniques like PL reveal useful information about diamond formation and color origin, we must first discuss the anatomy of a carbon atom and how it interacts with energy to produce luminescence. Figure 4 provides a simplified model for an isolated carbon atom within the diamond lattice, showing the nucleus and electron orbits, including the “excited” state. It is important to remember that in solids, atoms are not isolated and do interact with surrounding atoms. These interactions broaden the allowed energy states into bands (valence and conduction, at the center of the figure). The energy region between these bands, where certain energy states associated with a perfect diamond lattice are forbidden, is known as the band gap. In figure 4, the band gap is expanded. The excitation energies provided by a range of fluorescence lamps and commonly used lasers are shown, as well as the states of typical diamond defects that fall within the band gap. In spectroscopy, particularly with sensitive techniques like PL, such atomic-level defects are quite helpful in identifying a diamond’s origin and subsequent treatment. These optical centers function as storytellers of a diamond’s history.
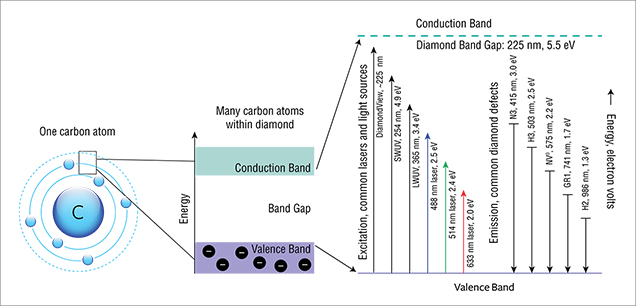
In addition, the excitation source generally has an energy equal to or greater than the emission energy; in other words, a 633 nm laser (2.0 eV) will not activate the N3 center in diamond (3.0 eV; 415 nm). In practice, certain defects are also more efficiently excited by particular laser wavelengths. For example, most PL peaks in the 900–1000 nm range are more intense when activated by a 785 or 830 nm laser than by a 325 nm laser. Hence, PL spectra are typically acquired using lasers of various wavelengths.
Photons and Phonons: ZPLs and Sidebands. A photon is a single (quantum) particle of visible light and other forms of electromagnetic radiation, while a phonon is a quantum particle of directional vibration for a group of atoms (such as a luminescence-exciting defect) within the crystal lattice. The zero-phonon line (ZPL) is the wavelength at which a photon is emitted between energy levels when no phonons—that is, no vibrations—are involved.
The photon energy of the emitted light from an optical center corresponds to the energy released when an excited electron returns to its ground state; there is also a contribution of internal energy loss due to the lattice vibration. The optical center is usually an imperfection of the crystal lattice—from either the presence of an impurity atom or an interruption in the lattice structure. This distortion modifies the vibration characteristics of the atoms in the vicinity of the optical center within the host material. Therefore, many optical defects show not only an electronic transition but also this vibronic contribution, known as a “phonon sideband.” Depending on the strength of the vibronic contribution, the purely electronic transition (i.e., the zero-phonon line) sometimes can only be detected at cryogenic temperatures.
The energy levels of the valence band and the conduction band shown in figure 4 are simplified representations. Contained within these electronic energy levels are subdivisions based on vibrational energy levels, which are determined by the way the defects can vibrate within the diamond lattice.
One might envision, in very simplified terms, that the ground state is the ground floor of a building and the excited state is the first-floor landing (figure 5). The vibrational levels would be steps on a staircase between the two floors. In PL spectroscopy, the ZPL can be seen as a direct jump from the first-floor landing to the ground floor; as its name implies, a ZPL generally does not involve phonons (i.e., vibration).
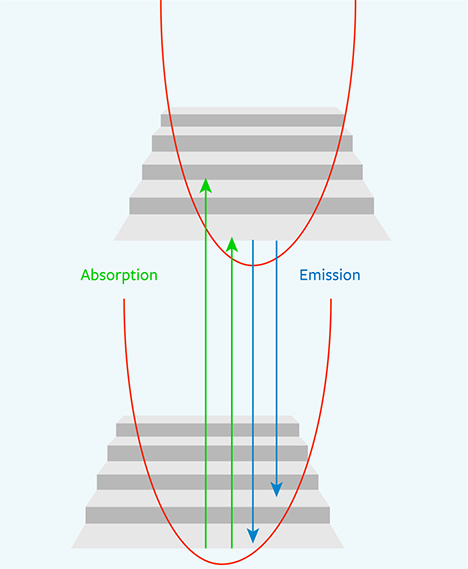
In absorption, the electron resting on the ground floor can be excited up to the first-floor landing or to the first or second step above the first-floor landing. In fluorescence, an electron might be sitting on the first-floor landing and then jump down to either the ground floor or the first or second step above the ground floor. This variability in the starting and ending staircase steps spreads out the energy released by the resulting photons, creating both the broad fluorescence bands observed at room temperature and the sidebands of the ZPLs usually observed at liquid nitrogen temperatures (figure 6).
The ZPL is a sharp peak often referred to in PL spectra precisely because its wavelength is exact, specific to a certain defect, and unambiguous; however, its underlying mechanism may not be understood by scientists who use PL spectra daily. The width of the ZPL is determined by the lifetime of the excited state (Sauer et al., 2010), though in practice it will be broadened by strains in the crystal.
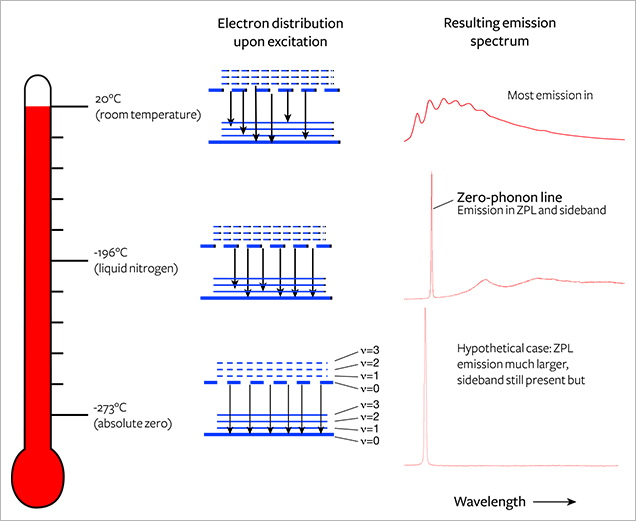
For a diamond immersed and cooled in liquid nitrogen (77 K, –196°C; figure 6), most of the electrons reside at the ground state. When activated, they will create emission at the ZPL wavelength. As temperature is increased, the electronic transitions are dispersed over broader ranges so that the resulting fluorescence is distributed across a wider wavelength range. At room temperature, the ZPL all but disappears in most cases and only the sideband remains. Usually the distribution of intensity between the ZPL and the phonon side band is strongly dependent on temperature. At room temperature, there is enough thermal energy to excite many phonons, and the probability of zero-phonon transition is much lower (again, see figure 6).
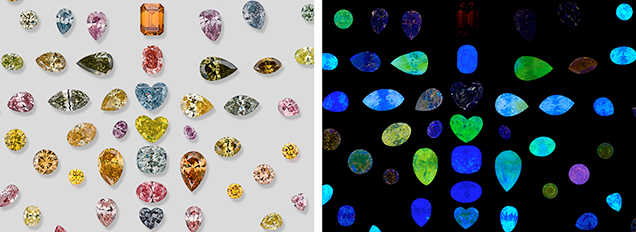
Comparison with Fluorescence and Phosphorescence. Occasionally, definitions of terms within a scientific context are different from, and perhaps at odds with, their common usage. Within the field of gemology, the terms fluorescence, phosphorescence, and photoluminescence have evolved from their general scientific definitions and taken on different meanings. Fluorescence and PL are scientifically regarded as similar processes in which fluorescence is a subset of PL with lifetimes less than 10 nanoseconds (again, see figure 3). Gemology draws a different distinction between these two terms. Both fluorescence and PL detect the same features within gemstones, but the experimental output is vastly different. In gemology, fluorescence has traditionally been measured at room temperature, typically with a broadband or multi-band lamp (although LED lamps have been a significant improvement; Luo and Breeding, 2013). The eye or a low-resolution spectrometer functions as the detector. Conversely, PL spectra of diamond are collected at liquid nitrogen temperature using laser excitation and a high-resolution spectrometer (figure 7). Figure 8 shows how temperature, excitation source, and spectrometer resolution affect the quality of the emission spectra collected from both traditional fluorescence measurement and PL analysis.
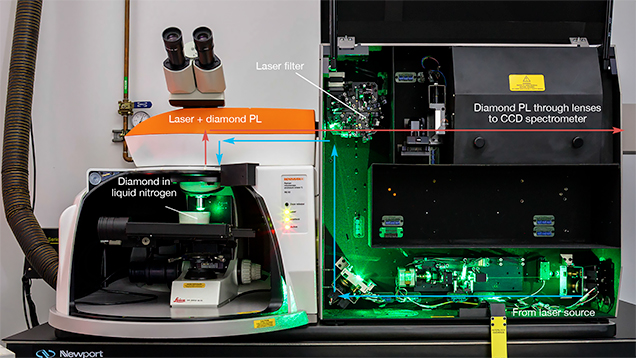
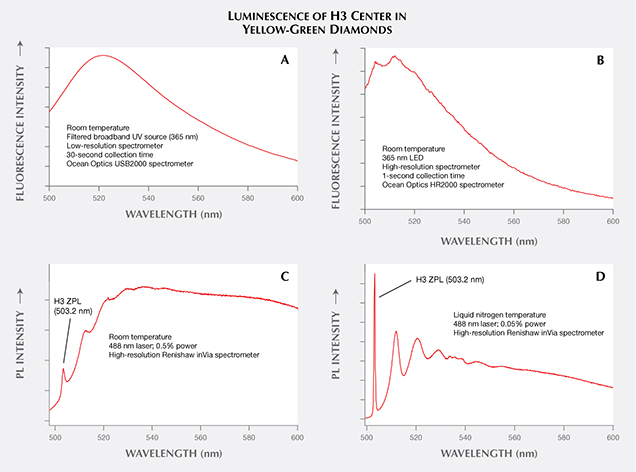
A laser used for PL spectroscopy offers several advantages over both standard UV lamps and tunable spectrofluorometer instruments in detecting fluorescence. Many traditional mercury-based long- and short-wave UV lamps excite multiple different wavelengths simultaneously (Williams, 2007; Luo and Breeding, 2013), which can create variability in the observed fluorescence color (Eaton-Magaña et al., 2007). Spectrofluorometers are able to filter a single excitation wavelength to a narrow range, but the resulting intensity is reduced because of the lower illumination power. The use of lasers addresses both problems by providing intense illumination over a very narrow wavelength range. In combination with sample cooling, laser excitation often reveals smaller PL peaks that might not be visible at room temperature or with other excitation sources (e.g., figure 9).
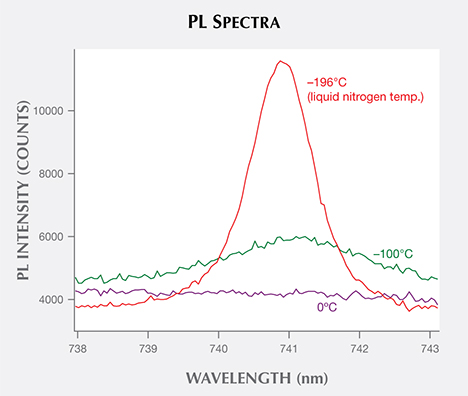
Physicists define fluorescence as luminescence with a decay time of 10 nanoseconds or less, while phosphorescence is delayed luminescence with a decay time greater than approximately 10 nanoseconds (again, see figure 3). Sophisticated analytical tools can measure these very short decay times (their potential usefulness will be discussed below). Within gemology, fluorescence is colloquially defined as the emission from the gemstone when a UV source is turned on, and phosphorescence is the observed emission after the UV source is turned off. Practically speaking, gemologists can visually detect phosphorescence only when the decay time is about one second or longer. A few natural diamonds, such as chameleons and type IIb stones, show visible phosphorescence (e.g., Hainschwang et al., 2005; Eaton-Magaña and Lu, 2011), as do some HPHT synthetics (Shigley et al., 1997) and HPHT-treated CVD synthetics (Wang et al., 2012). Beyond that, the usefulness of phosphorescence is somewhat limited.
Fluorescence and phosphorescence techniques both offer simple, inexpensive methods to create additional identifiers of an individual gem (i.e., to better distinguish similar-looking diamonds). For additional information on specific fluorescence and phosphorescence reactions, see Shigley and Breeding (2013) and Luo and Breeding (2013).
Sensitivity of PL. Many nitrogen-containing defects, such as the neutral and negatively charged NV centers (ZPLs at 575 and 637 nm, respectively; Zaitsev, 2003), are routinely observed using PL in type II diamonds, which by definition contain negligible nitrogen impurities measurable by infrared absorption. As mentioned earlier, a major advantage of PL analysis is its high sensitivity to weak emission of light. Even in diamonds with nitrogen impurity concentrations below the 1–5 parts per million detection limits for infrared absorption instruments (i.e., type II diamonds), PL can detect NV concentrations of 10 ppb or less (Wotherspoon et al., 2003). Therefore, the type II designation does not indicate “no nitrogen whatsoever,” but that the diamond has potentially very low quantities of this impurity. Nitrogen-bearing defects (such as H2, H3, H4, NV centers, and N3) are typically the dominant features in PL spectra of type IIa diamonds. However, nitrogen A and B aggregates in type Ia diamonds do not have characteristic emissions identifiable using PL, and their presence is best detected with FTIR absorption spectroscopy (Zaitsev, 2003). In practice, FTIR is performed first on a diamond to identify the diamond type. This diamond type determination allows gemologists to filter out type II diamonds, which are potentially treated or synthetic, from type Ia, which represent the vast majority of natural diamonds (Breeding and Shigley, 2009).
USE OF PL IN GEMOLOGY
PL came to widespread prominence in the diamond industry in 1999, when General Electric (GE) announced an HPHT treatment method for decolorizing type II brown diamonds (“Pegasus Overseas…,” 1999; Shigley et al., 1999). Standard gemological testing could not identify the HPHT-treated diamonds, but the sensitivity of PL allowed the separation of these goods from their natural-color counterparts. Since then, the evolution of treatments and synthesis techniques has made the use of these complex analytical identification methods and instruments, such as mapping spectrometers and automated gem testing, more widespread in major gemological laboratories.
HPHT-Treated Diamonds. After the initial industry panic that followed GE’s revelation, extensive research showed that PL spectroscopy of diamond at liquid nitrogen temperatures was the most effective method for identifying HPHT treatment (Fisher and Spits, 2000). Natural type IIa brown diamonds are typically the starting material for the decolorizing HPHT treatment process. The brown color of the starting material is thought to be caused by clusters of vacant atom positions (i.e., vacancies) along planes of carbon atoms in the diamond structure that were misaligned by natural plastic deformation processes (Hounsome et al., 2006). When the vacancy clusters are broken up at high temperatures, the brown color is removed, leaving a colorless or near-colorless diamond, but also telltale evidence of the treatment process that is detectable by PL.
Natural diamond formation takes millions of years. Regardless of a treatment’s sophistication, there is usually detectable evidence of the much shorter process (minutes to hours in the case of HPHT treatment). The elapsed time of natural diamond formation simply cannot be replicated in a laboratory. Most of the PL features that indicate treatment are not discussed publicly, out of concern that treaters will modify their techniques in an attempt to deceive laboratories. A few have been disclosed, however. It has been widely reported that after HPHT treatment, the intensity of the 637 nm PL peak (NV–) is stronger than its 575 nm (NV0) counterpart when excited by a 514 nm laser. For most natural type II diamonds, this ratio is inverted. At the treatment conditions required to remove brown coloration, HPHT processing commonly breaks down nitrogen aggregates to create single substitutional nitrogen impurities, which behave as electron donors. Charge transfer of the newly available electrons causes the PL intensity of the 637 nm defect (the negatively charged NV– center) to increase relative to the 575 nm center (the neutral NV0 center) (Chalain et al., 2000). Although PL was initially used to determine HPHT treatment in colorless diamonds, it is now often used to detect diamond formation and color origin for both colorless and colored diamonds (Wang et al., 2012).
Combination-Treated Diamonds. In the years since HPHT treatment was first introduced, diamonds have been subjected to HPHT annealing in combination with earlier treatments such as irradiation and lower-temperature annealing; this has made the identification process even more complex. Multi-treatment processes may be used to create certain attractive colors such as pink, but they can also be used to conceal previous treatments and make a diamond appear more spectroscopically “natural.” Regardless, absorption and PL spectral features, in conjunction with gemological properties, are required to identify many treated diamonds. It has become increasingly important to investigate the presence and absence of a combination of PL features, in addition to data from other spectroscopic and gemological techniques, rather than simply rely on analysis of a single feature or a single technique.
Synthetic Diamonds. Over the past several years, gem-quality synthetic diamonds grown either by chemical vapor deposition (CVD) or HPHT methods have become increasingly available in the market, but they still comprise a very small percentage of diamonds analyzed by gemological laboratories. CVD synthetic diamonds have different inclusions and growth morphology from those observed in HPHT-grown synthetics. Rapid advances in CVD synthesis techniques in the last decade have complicated the gemological separation of these materials. High-quality PL spectroscopy has proven essential to their proper identification (e.g., Wang et al., 2007, 2012; Song et al., 2012). PL spectroscopy can discern a CVD origin and determine if any post-growth treatments have been applied.
Other Gem Materials. Although diamonds are the focus of this article, PL spectroscopy can be applied to other gem materials. Raman analysis has been a reliable gemstone identification tool for decades, and its instrumentation often proves quite useful in the collection of PL spectra (see box A for a description of the differences between these techniques). For example, the separation of natural from synthetic spinel can be quite difficult in high-clarity gemstones. Yet PL analysis of stones with chromium fluorescence bands can easily distinguish synthetic spinel (Kitawaki and Okano, 2006). Similar features provide evidence of heat treatment in natural spinel to enhance their color (Saeseaw et al., 2009; Kondo et al., 2010). Bidny et al. (2010) showed that photoluminescence excitation (PLE) spectroscopy, a variation on standard PL, can also separate natural from flux-grown synthetic rubies. While PL uses a single laser and scans the emission wavelengths, PLE holds the emission wavelength fixed and scans the excitation range. For example, excitation spectra for the chromium peaks at 692/694 nm showed an additional band at approximately 290 nm in flux synthetic rubies only (Bidny et al., 2010).
PL spectroscopy has also proven useful for some organic gemstones. Combined with Raman spectroscopy, it can separate natural red coral from dyed coral (Smith et al., 2007). Features in PL spectra are also able to distinguish natural-color cultured pearls from artificially colored ones (Wang et al., 2006; Karampelas et al., 2011). When combined with gemological techniques, PL shows features that distinguish tortoiseshell from some of its imitations (Hainschwang and Leggio, 2006).
Unfortunately, most gemstones cannot be cooled to liquid nitrogen temperatures to optimize the results from PL spectroscopy. Diamonds have extremely high thermal conductivity and a low thermal expansion coefficient, which allows them to withstand low temperatures. Other gems are exposed to a much higher risk of fracture if cooled. For example, the thermal conductivity of corundum is at least 65 times lower than that of diamond (Read, 2008), and its coefficient of thermal expansion is five times greater (Fiquet et al., 1999).
FUTURE
In the last decade, the use of PL to determine diamond origin has become commonplace in gemological research laboratories, while PL analysis itself has become more complex. When HPHT treatment was first introduced, a visual evaluation of the presence or absence of particular PL peaks from a single laser, analyzing two or three wavelengths at most, was adequate for identification. As diamond treatments and synthetics have become more sophisticated, standard procedure now requires many more resources. Lasers across the UV-visible-NIR wavelength range should be used, as different laser wavelengths efficiently activate different ranges of PL features; the authors regularly use six different laser excitation wavelengths (325, 457, 488, 514, 633, and 830 nm). Over the next decade, PL spectroscopy in gemology will continue to evolve toward smaller, more portable instruments (see Breeding et al., 2010 for an extensive discussion) and different analytical domains, possibly to the less-studied PL dimensions of temperature, time, and spatial mapping.
Temperature- and Time-Resolved PL Analytical Possibilities. For the past decade or so, diamond PL analysis has been performed with the sample temperature stable and the laser power constant. In addition to the exploration of PLE applications (again, see Bidny et al., 2010), further investigations of temperature effects on photoluminescence and how PL features decay within the initial nanoseconds after the laser is switched off (time-resolved PL) may help solve complex identification problems.
For example, NV color centers in diamond appear identical in PL spectra of natural, treated, and synthetic samples. Does this center appear different for natural or treated stones at temperatures between liquid nitrogen and room temperature or at the even colder temperatures produced by liquid helium? Thermoluminescence (TL), the luminescence response as temperature is increased, has not yet been fully explored for gem materials. Researchers have used TL above room temperature in order to distinguish the dose of gamma radiation in treated CVD diamonds. At their experimental conditions, the response of natural diamonds was too weak for comparison (Karczmarska et al., 2012). Additionally, novel TL responses have been observed in diamond (Nelson and Breeding, 2011) and other colored stones (e.g., Choudhary, 2010).
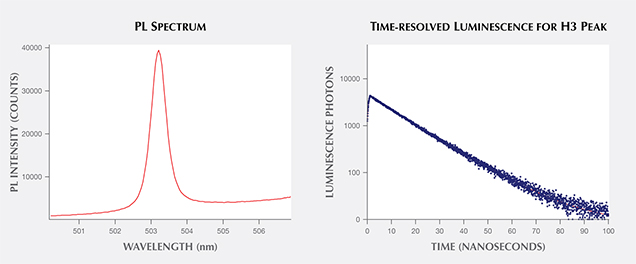
For time-resolved luminescence, scientists examine the peak’s behavior in the initial nanoseconds after a laser is turned off and the peak’s emission dies off. Investigations of the decay curves of various diamond defects may reveal important differences between natural, treated, and synthetic diamonds that aid in their identification. Studies, particularly in biological fields, have shown that a great deal of molecular information is contained within the length of this decay time and within the shape of its decay curve. Additional intensity information could demonstrate two decay times, indicating the presence of multiple defects or energy states (Lakowicz, 2006). Researchers have also shown that the luminescence lifetime of the NV0 center (ZPL at 575 nm) in diamond can be shortened by the presence of single substitutional nitrogen (Liaugaudas et al., 2012). Ongoing research is probing the differences in decay times of various color centers between natural, treated, and synthetic gems to expand beyond the standard “steady-state” PL measurements (e.g., figure 10; Eaton-Magaña, 2015).
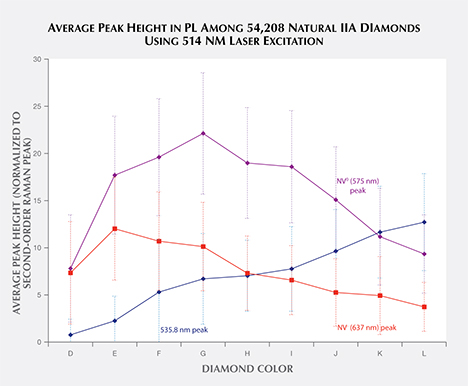
Database of Large Quantities of Data. Prelas et al. (1998) estimated that 100 vibrational and 400 electronic optically active defects are possible within diamond. This quantity of measurable defects, combined with the large quantities of diamonds analyzed in a gem research laboratory, has generated vast repositories of spectral data—a specialized resource that cannot easily be duplicated in most academic environments. Thus, gemological laboratories are unique in their ability to ascertain large-scale spectral trends across thousands of diamonds. To take full advantage of the data, automatic software processing is needed to find and analyze spectral peaks and incorporate them into a robust searchable database. Development of reliable peak-finding/peak-fitting algorithms for rapid automatic processing of all collected spectra is nearly as important as the analysis itself. Our work is ongoing, but we can find and characterize peaks based on their presence or absence and other peak characteristics such as height, as shown in figure 11. The large-scale data mining of spectra can reveal new patterns. For example, the configuration of the defect causing the 535.8 nm peak is unknown (figure 11), but the steady increase in peak height as color increases from D to L may indicate that its configuration is related to the origin of color in type IIa diamonds. The availability of bulk PL peak information from a vast supply of spectra opens numerous statistical possibilities for data analysis across thousands of samples, revealing trends and connections that were heretofore unseen.
CONCLUSION
Treated-color and synthetic diamonds are readily available in today’s diamond market. Every gemstone, whether natural, laboratory grown, or color treated in some way, has a story behind its creation, and every customer has a right to know that story through proper identification. Over the last decade, PL analysis has become one of the most important tools to document these unique stone histories. PL has also proven to be a reliable gemological identification tool, helping laboratories properly disclose the origin and treatment history of diamonds and other gemstones to ensure public trust in the gem and jewelry industry. Ongoing research using PL and other analytical techniques will continue to unlock more of each gemstone’s secrets.


