Natural Type IIa Diamond with Unusual Red Fluorescence Distribution

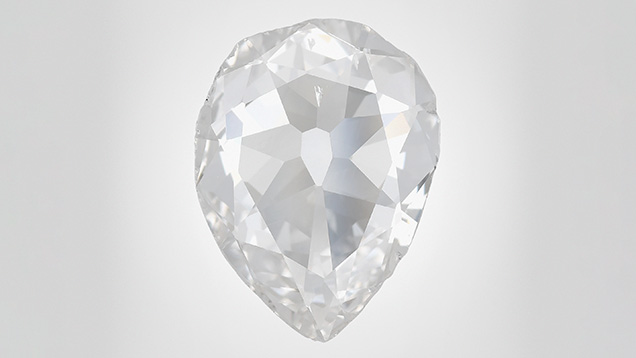
The Carlsbad laboratory received a natural type IIa diamond with some unusual characteristics. As part of the standard data collection, the diamond type was determined by Fourier-transform infrared (FTIR) spectroscopy and deep-UV fluorescence images collected using the DiamondView instrument. The DiamondView images revealed predominantly red fluorescence on one side of the diamond and blue fluorescence on the other. This 3.58 ct pear modified brilliant diamond had H color and received an SI2 clarity grade due to cavities, chips, and a feather (figure 1).

Type IIa diamonds typically display a blue fluorescence pattern under deep UV as a result of “band A” fluorescence or the N3 defect in the stone (U.F.S. D’Haenens-Johansson et al., “Synthesis of diamonds and their identification,” Reviews in Mineralogy and Geochemistry, Vol. 88, No. 1, 2022, pp. 689–753). High amounts of nitrogen vacancy (NV) centers can cause red fluorescence in diamonds; however, this is rare in type IIa stones, as they are defined by nitrogen concentrations low enough to be undetectable by FTIR (Summer 2016 Lab Notes, pp. 189–190). The NV centers can be detected in a negative charge state (NV–, zero-phonon line at 637 nm) or a neutral state (NV0, zero-phonon line at 575 nm). Photoluminescence (PL) testing revealed much higher concentrations of both NV centers in the red-fluorescing region of the stone (figure 2). This distribution could have occurred if traces of isolated nitrogen were concentrated in one growth area of the stone.

PL mapping using 532 nm laser excitation (figure 3) displayed the relative intensities of these defects, demonstrating the wide distribution of the NV centers in opposite sides of the table and crown facets of this diamond. Analysis of this interesting fluorescence feature demonstrated that nitrogen could have been distributed unevenly in a relatively pure type IIa diamond when it initially formed.


