A Newly Discovered Iridescent Andradite from Inner Mongolia, China

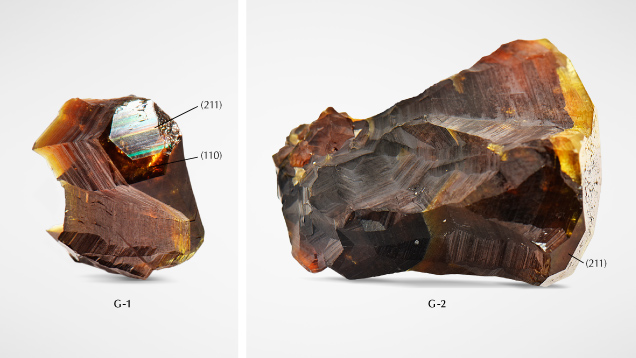
Iridescent garnet found in Chifeng City, Inner Mongolia, was recently encountered in the Chinese market. Iridescent garnet was first discovered in 1943 in the U.S. state of Nevada (E. Ingeron and J.D. Barksdale, “Iridescent garnet from the Adelaide Mining District, Nevada,” American Mineralogist, Vol. 28, 1943, pp. 303–312), and it is also found in Mexico and Japan (M.A. Badar and M. Akizuki, “Iridescent andradite garnet from the Sierra Madre Mountains, Sonora, Mexico,” Neues Jahrbuch für Mineralogie - Monatshefte, Vol. 1997, No. 12, pp. 529–539; T. Hainschwang and F. Notari, “The cause of iridescence in rainbow andradite from Nara, Japan,” Winter 2006 G&G, pp. 248–258). To the authors’ knowledge, this is the first report of iridescent garnet in China. Two rough samples were collected by the authors in the Lindong lead mining area (figure 1). The refractive index was over the limits of a conventional refractometer, and the hydrostatic specific gravity values were 3.85 and 3.84. Both showed an inert reaction to long- and short-wave ultraviolet fluorescence. These standard gemological testing results were consistent with garnet.


On the basis of energy-dispersive X-ray fluorescence, calcium, silicon, iron, aluminum, manganese, magnesium, titanium, and sodium were detected. The chemical composition of the larger sample was analyzed using electron probe microanalysis (EPMA). The composition was consistent with that of andradite, containing major elements of calcium, iron, aluminum, and silicon, with the derived chemical formula of (Ca3.015Mn0.031Na0.006Mg0.003Ti0.002) (Fe1.846Al0.138)[Si2.978O12]. The backscattered electron image showed clear growth layers (figure 2, left). Aluminum in the darker zones was about 2 wt.% higher on average than in the lighter zones, and the iron content decreased with increasing aluminum. Raman spectroscopic analysis involved comparison with the RRUFF database (B. Lafuente et al., https://rruff.info/about/downloads/HMC1-30.pdf). The peak positions (figure 3) indicated that the samples were consistent with those of andradite, supporting the composition inferred from EPMA. Raman shifts within 300 to 400 cm–1 were assigned to SiO4 rotational vibrations. Raman shifts within 400 to 700 cm–1 were caused by Si-Obend (bridge oxygen) bending and asymmetric stretching vibrations. Raman shifts at 800 to 1200 cm–1 were attributed to the characteristic absorption peak of Si-Ostr stretching vibration (B.A. Kolesov and C.A. Geiger, “Raman spectra of silicate garnets,” Physics and Chemistry of Minerals, Vol. 25, No. 2, 1998, pp. 142–151).


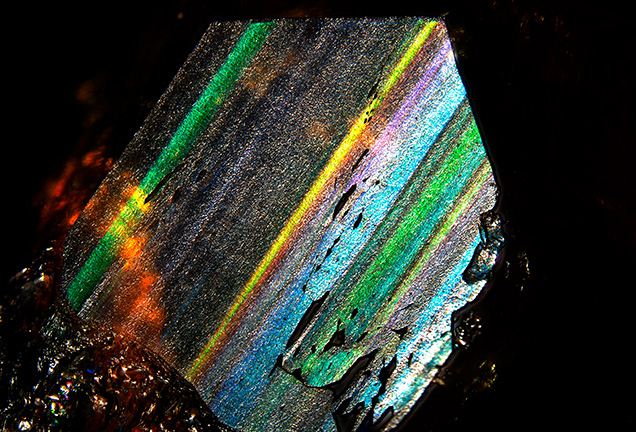
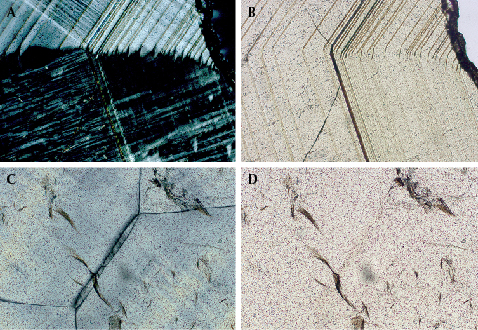
Microscopic observation revealed an attractive play-of-color with a complete visible spectrum of colors on the (211) crystal plane of sample G-1 (figure 4). We cut three polished thin sections from sample G-2 along the (110) and (211) crystallographic axes to observe the twinning structure and extinction phenomena under a polarizing microscope. The sample displayed angled layered growth structures and a strong grid-like pattern and abnormal birefringence (figure 5). A grid-like extinction phenomenon parallel to the growth layer (figure 5A) may have been caused by lattice-like twins, and figure 5C shows two areas with different extinction orientations. One study on Japanese andradite showed that the iridescence effect is caused by the alternate growth of iron-rich layers and aluminum-rich layers. These layers cause a thin-film interference phenomenon in the crystal structure (Hainschwang and Notari, 2006). Therefore, we speculate that the iridescence of andradite from the Lindong lead mining area is not closely related to twinning but may be closely related to thin-film interference caused by its layered growth structure.


