Novelty Cut Diamond with Remarkable “Fire and Ice” Fluorescence
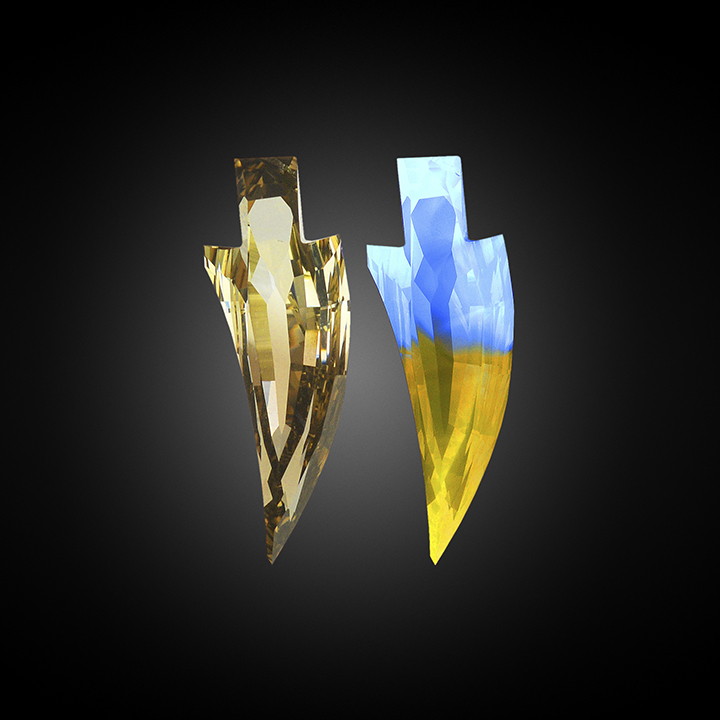
A 0.37 ct Fancy yellowish brown diamond (figure 1, left) was recently submitted to the Carlsbad laboratory for Color Origin and Identification service. This novelty cut, faceted to resemble a dagger or sword, was remarkable for its well-defined hydrogen-rich and cape regions, which created a distinctive fluorescence pattern. The “blade” section of the diamond fluoresced a strong yellow color, while the “hilt” fluoresced a strong blue (figure 1, right). As a result, we thought this diamond was an interesting interpretation of a lightsaber.
Microscopic examination showed that throughout the yellow-fluorescing area were cloud inclusions, consisting of a high density of light-scattering micro-inclusions that correlate strongly with the presence of hydrogen. These are often called “hydrogen clouds” due to their coincidence with notable concentrations of hydrogen-related defects (W. Wang and W. Mayerson, “Symmetrical clouds in diamond—the hydrogen connection,” Journal of Gemmology, Vol. 28, No. 3, 2002, pp. 143–152).

The infrared absorption spectra showed a type Ia diamond with saturated concentrations of nitrogen. Spectra recorded from the individual sectors were consistent with the gemological observations, as the yellow-fluorescing section containing the “hydrogen clouds” did show significantly more hydrogen than the blue-fluorescing area (figure 2).


To better understand the defects creating the dramatic difference in both the observable color in daylight and the fluorescence color under long-wave UV (figure 3), we performed photoluminescence (PL) mapping using 455 and 532 nm excitation at liquid nitrogen temperatures. The maps revealed distinct differences between the two areas. The yellow-fluorescing area showed peaks at 603 nm, a doublet at 641 and 645 nm, and a strong peak at 700.5 nm in the 532 nm PL spectra (figure 4). These peaks have all been ascribed to nickel and are often seen in hydrogen-rich diamonds (K. Iakoubovskii and G.J. Adriaenssens, “Optical characterization of natural Argyle diamonds,” Diamond and Related Materials, Vol. 11, No. 1, 2002, pp. 125–131; S. Eaton-Magaña et al., “Inclusion and point defect characteristics of Marange graphite-bearing diamonds after high temperature annealing,” Diamond and Related Materials, Vol. 71, 2017, pp. 20–29). The blue-fluorescing area only shows a very small peak at 700.5 nm in the 532 nm PL map.

For PL spectra collected at 325 nm excitation, the N3 center is the major feature within the blue-fluorescing area, while a broad band centered at ~550 nm dominates the yellow-fluorescing area (figure 5). Also detected were peaks at 488 nm (ascribed to nickel; I.A. Dobrinets et al., HPHT-Treated Diamonds, Springer, 2013), 522 nm (unassigned), and the 603 and 700.5 nm peaks mentioned above. The yellow-fluorescing area also showed elevated intensities of the 490.7 nm peak (a natural feature in type Ia diamonds) in the 455 nm PL map and peaks at 926 and 948 nm (features also often seen in diamonds enriched with hydrogen and nickel; Eaton-Magaña et al., 2017) in the 830 nm excitation PL spectra.
Gemological and spectroscopic examination yielded interesting features such as this diamond’s two distinct growth chemistries. The blue-fluorescing area had few inclusions and the typical fluorescence and PL spectroscopy of a cape diamond. The yellow-fluorescing side had higher hydrogen-related peaks in the infrared, hydrogen cloud inclusions, and pronounced nickel-related peaks in the PL spectra that are often seen in hydrogen-rich diamonds.
The cutting style of this diamond, while unconventional, served to showcase the remarkable fluorescence scene illuminated within. The fluorescence differences allow this diamond to be imagined as a lightsaber or a sword of fire and ice.


