Pressed Gibbsite and Calcite as a Rhodochrosite Imitation
ABSTRACT
A new rhodochrosite imitation has appeared in the market, with gemological properties, chemical composition, and structural characteristics that are different from natural rhodochrosite. In this investigation, four samples—two imitations and two rhodochrosites—were examined by standard gemological testing, scanning electron microscopy, energy-dispersive spectroscopy, X-ray diffraction, FTIR, and Raman microspectroscopy. Examination revealed that the imitations are composed of pressed gibbsite and calcite powder with a granular structure, which are easy to identify through standard gemological testing.
INTRODUCTION
Rhodochrosite (MnCO3), the national stone of Argentina, is known as “Inca Rose” for its red and white bands (Xing, 2015). The most significant producer is the Sweet Home mine in the American state of Colorado, which can produce transparent, vivid red single-crystal rhodochrosite (Knox and Lees, 1997). Rhodochrosite for lapidary and mineral specimens is also found in South Africa, Peru, Australia, Romania, Spain, Russia, Mexico, Japan, China, and the American state of Montana (Yu, 2016).
Rhodochrosite has a beautiful pink to deep red bodycolor and usually occurs as a translucent to opaque stone, mostly showing a white banded pattern (Zwaan, 2015). In recent years, it has been processed into center stones for rings and used in pendants, necklaces, and bracelets. Unique and ornamental pieces are also popular with mineral connoisseurs, and thus the value of rhodochrosite has continued to rise (Knox and Lees, 1997).
Imitation rhodochrosite is rare because the complex banded pattern in the natural material is difficult to mimic. Glass imitations have appeared on the market previously, but they could be distinguished from rhodochrosite by gemological properties (such as color, luster, and transparency), structural differences, and internal air bubbles (Zhang, 2006). Meanwhile, pressed materials are commonly used as imitations of turquoise, coral, and chicken-blood stone (Tian et al., 2004; Teng et al., 2008; Zhang et al., 2014), but not as a rhodochrosite imitation. Therefore, we were surprised to find a new rhodochrosite imitation on the market in the form of a pressed material.
We conducted analyses to study the new imitation’s composition and micro-structure characteristics as well as methods for its identification.
MATERIALS AND METHODS
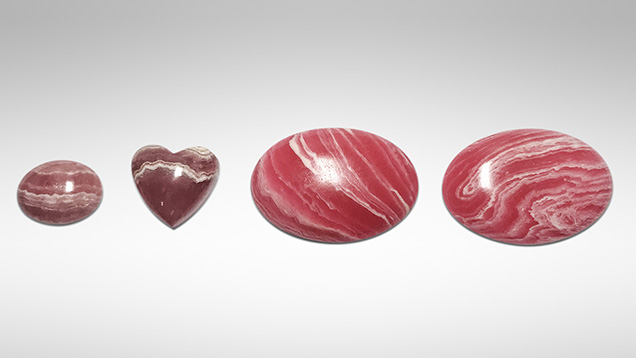
Four samples of rhodochrosite and its imitations ranging from 8.20 to 20.59 ct were analyzed for the study: rhodochrosite samples T1 and T2, and imitation samples F1 and F2 (figure 1). The rhodochrosite samples were from the gem laboratory of China University of Geosciences, and the imitation samples were obtained from the gem market in Wuzhou, Guangxi, China.
The samples were examined by standard gemological methods, including basic observation, refractive index measurement, fluorescence reaction under long-wave (365 nm) and short-wave (254 nm) UV, and hydrostatic specific gravity testing.
The micro-structure of the samples was examined by a scanning electron microscope (SEM, JEOL JSM-7800F) with a working voltage of 15 kV and a working distance of 10 mm.
SEM-EDS (Oxford X-Max50) was used to quantitatively analyze the chemical compositions of both the natural and imitation rhodochrosite stones. The chemical compositions in weight percentages were obtained on multiple points in the various red and white regions of each, and elemental mapping allowed us to see the chemical variations of these same regions.
X-ray diffraction (XRD) was performed using a Shimadzu XRD-7000S to conduct phase analyses with the test conditions of Cu target, tube voltage 40 kV, tube current 30 mA, and test angle 5°–90°. We used linkage scanning mode, a scanning speed of 5°/min, and a step size of 0.02°.
Infrared spectra were recorded on a Bruker Tensor 27 infrared spectrometer using the specular reflection method and the KBr pressed-pellet technique with 4 cm–1 resolution. The scanning ranges were 2000–400 cm–1 and 4000–400 cm–1, respectively. Powder from the sample (about 0.5 mg) was mixed with potassium bromide (about 150 mg) in an agate pestle and mortar during the FTIR analysis. The powder was ground to a particle size of <2.5 μm.
Raman spectra were recorded on the four samples using a Horiba HR-Evolution Raman microspectrometer with an Ar-ion laser operating at 532 nm excitation between 1800 and 100 cm–1 and accumulating up to three scans.
RESULTS AND DISCUSSION
Visual Appearance and Standard Gemological Properties. The gemological properties of the samples are summarized in table 1. All four had a pink bodycolor with white bands, but the imitation and natural rhodochrosite were different in terms of band shape, luster, and transparency. Compared with the serrated, lace-like bands of rhodochrosite, the bands of the imitation were not as complex or smooth. The imitations also had lower luster and transparency than the natural samples (again, see figure 1).

These properties were sufficient to identify the imitations. The specific gravity of the imitations was about 2.00, much lower than the rhodochrosite’s. Moreover, the refractive index of the white band and the red part were different between the natural and imitation samples. The rhodochrosites had a refractive index of 1.60 in the red part and 1.63 in the white part. Meanwhile, the imitations had a refractive index of 1.56 for the red part and just 1.50 for the white part. The samples’ fluorescence responses under long-wave and short-wave UV light were noticeably different. The imitation had strong fluorescence under long-wave UV and weak fluorescence under short-wave, but the natural rhodochrosite was inert (figure 2).

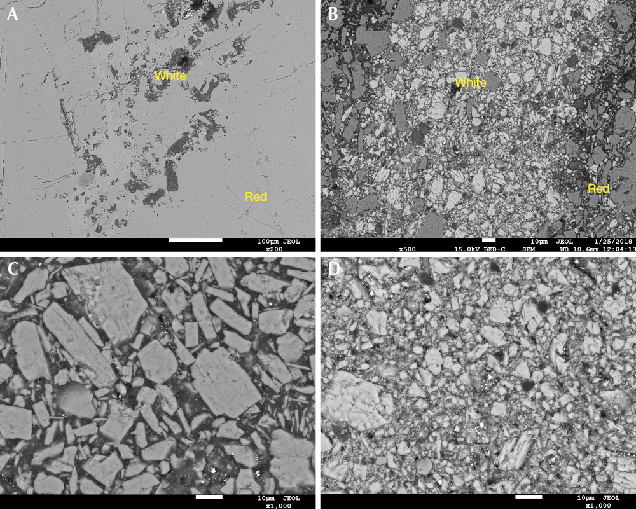
Micro-Structure. The micro-structure was another distinguishing characteristic (figure 3). The natural rhodochrosite had a smooth surface with few pits (figure 3A). Meanwhile, the imitation had a granular texture (figure 3B). The mineral particles of the red part were larger than those in the white parts (figure 3, C and D). Observing the junction of the red and white parts (figure 3B), it can be seen that the two kinds of mineral particles are mutually permeable with each other. Thus we came to the conclusion that the imitation is a pressed stone containing two kinds of material.
Element Mapping and Chemical Compositions. According to the element mapping, the natural samples mainly contained Mn, C, O, with few impurity elements of Fe and Ca (figure 4A). Rhodochrosite belongs to the carbonate family. Carbonates are a group of minerals with the same structure but slightly different compositions such as siderite (FeCO3), magnesite (MgCO3), and calcite (CaCO3). Thus some Fe, Ca, and Mg can replace Mn as impurity elements in rhodochrosite (Du and Fan, 2010).
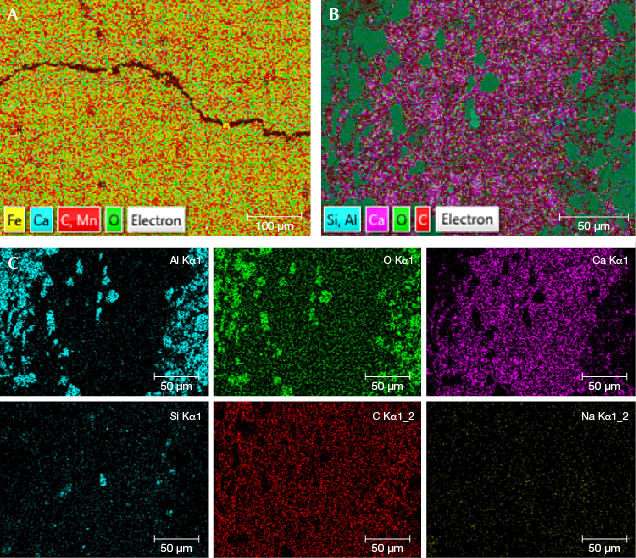
The red and white parts of the imitation had a very different composition from rhodochrosite (figure 4, B and C). The larger mineral particles in the red part mainly contained Al and O, while the smaller particles in the white bands mainly contained Ca, C, and O. The smaller minerals in the white bands also had a small amount of Si and Na as impurity elements. At the same time, we observed that the gap between the particles contained a large amount of C. This indicated that the mineral particles were Al and O compounds in the red part of the imitation, and calcium carbonate in the white part. Moreover, a large amount of C in the gap between the particles revealed that the imitation was perhaps formed by cementing and dyeing with mineral powder and organics.
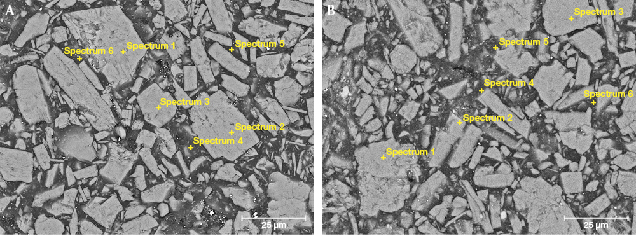
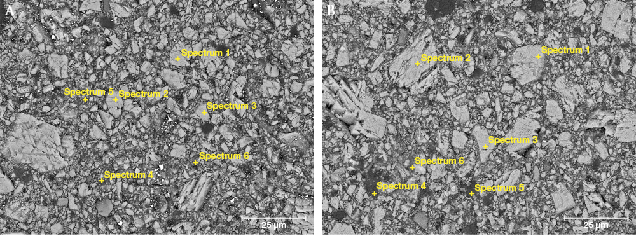
The EDS data in tables 2 and 3 agree well with the element mapping results. The red part of the imitation samples was mainly composed of Al and O, and contained little Na (F1R and F2R, points 1–3; figure 5); the white part was mainly composed of Ca, C, and O, with a small amount of Si and Na (F1W and F2W, points 1–3; figure 6). The content of C increased sharply (F1R, F2R, F1W, and F2W, points 4–6) when the test points were in the matrix of the imitation. This is probably due to the presence of organics in the mineral particle gap of the imitation.

According to the ICDD powder diffraction file (PDF-2) database and Li et al. (2009), the X-ray diffraction data confirmed the presence of rhodochrosite (figure 7, T1 and T2), matching PDF card 99-0089. Furthermore, according to the previously published report of the imitation turquoise (Zhang et al., 2014) and the chemical composition data obtained by EDS (tables 2 and 3), the red part of the imitation is Al(OH)3 (gibbsite), which matches PDF card 33-0018, and the white part is CaCO3 (calcite), matching PDF card 47-1743.


Infrared Spectroscopy. FTIR spectroscopy using the specular reflection method (figure 8) shows large differences between the infrared spectrum of rhodochrosite and the imitations.

According to Farmer (1974), the infrared spectrum of rhodochrosite does not show symmetric stretching vibration, while out-of-plane bending vibration and in-plane bending vibration are sharp absorption peaks that appear at about 900–600 cm–1; asymmetric stretching vibration is a strong and wide absorption peak, appearing near 1400 cm–1 (Li et al., 2009; Yang et al., 2015).
The infrared spectra of the red and white parts of the natural rhodochrosite samples are similar (figure 8, T2W and T2R). There are three characteristic absorptions in the range of 2000–400 cm–1: a wide absorption band of 1550–1400 cm–1 and sharp absorption peaks of 725 and 874 cm–1 in the range of 900–600 cm–1. The absorption of ν(C-O) in the 1550–1400 cm–1 range is wide and strong, the absorption at 874 cm–1 of ν(CO32–) is sharp and strong, and the absorption of ν(O-C-O) near 720 cm–1 is sharp but weak. According to Yang et al. (2015), the three characteristic absorptions of the natural rhodochrosite samples correspond to ν(C-O) asymmetric stretching vibration, γ(CO32–) out-of-plane bending vibration, and δ(O-C-O) in-plane bending vibration, respectively. These are characteristic absorptions of carbonate minerals.
As figure 8 shows, the infrared spectrum of the white part of the imitation is different from the red part. The main absorption peaks of the red part of the imitation (figure 8, F1R) are the peak at 1020 cm–1, the broad peak at about 800–740 cm–1, and the series of weak and sharp peaks in the 600–400 cm–1 range, which correspond to the ν(Al-O-H) stretching vibration and the related vibration of the hydroxyl group (Zhang et al., 2014). According to the attribution of the infrared spectrum peaks, we determined that the red part of the imitation is composed of gibbsite-Al(OH)3.
However, the white part of the imitation (figure 8, F1W) has four characteristic absorptions in the range of 2000–400 cm–1: the stretching vibration peak of ν(C-O) at 1716 cm–1; the asymmetric stretching vibration of ν(C-O) at 1412 cm–1; γ(CO32–), the out-of-plane bending vibration peak at 873 cm–1; and the out-of-plane bending vibration of δ(O-C-O) at 720 cm–1, which are characteristic absorptions of carbonate. In addition to the absorption at 1020 cm–1 is the absorption caused by the Al(OH)3 particle mixed in the white part. These peaks are also characteristic absorptions of carbonate minerals, and thus the attribution of peaks is similar to that of natural rhodochrosite (figure 8; Yang et al., 2015).
The KBr pressed-pellet technique was used for more accurate and comprehensive determination of the samples’ infrared spectra in the 4000–2000 cm–1 range. It can be seen from figure 9 (T1) that the absorption peaks of the natural rhodochrosite sample in the 1500–400 cm–1 range were the same as those measured by the reflection method (figure 8). The ν(C-O) stretching vibration peak appears around 1800 cm–1 (Li et al., 2009; Yang et al., 2015). The absorption peak at 3446 cm–1 could be caused by the water absorption of KBr.
In addition to the characteristic peaks similar to those measured by the reflection method, many characteristic absorptions of the imitation (figure 9, F1) are caused by the organics and water. The absorptions of the ν(OH) symmetric stretching vibration appear at 3621, 3527, 3469, and 3369 cm–1 in the range of 4000–3000 cm–1, which may be caused by the (OH) from Al(OH)3 or the organics (Chen et al., 2006).
The absorptions at 2926, 2854, and 1453 cm–1 are caused by ν(C-H) asymmetric stretching vibration, ν(C-H) symmetric stretching vibration, and δ(C-H) deformation vibration of CH2, respectively (Chen et al., 2006; Teng et al., 2008).
Two peaks near 1731 and 1140 cm–1 are caused by symmetric stretching vibrations of ν(C=O) and ν(C-O-C) of the ester group. And the absorptions of the asymmetric stretching vibration of ν(C=C) in the benzene ring are at 1600 and 1508 cm–1. Moreover, the absorption peak at 1286 cm–1 is caused by OH, and the 968 cm–1 peak is caused by the bending vibration of an unsaturated hydrocarbon group (=C-H) (Tian et al., 2004; Chen et al., 2006; Teng et al., 2008).
It can be inferred that the organic material in the matrix of the imitation is a kind of resin used for cementing or dyeing. According to Chen et al. (2006), it could be styrene or a similar compound.

Raman Spectroscopy. Figure 10 presents the Raman spectra of the red and white parts of the rhodochrosite and the imitation rhodochrosite in the 1800–100 cm–1 range. There are six groups of Raman shifts in the rhodochrosites (figure 10, T2W and T1R). The peak at 182 cm–1 is related to the lattice vibration of rhodochrosite. The peaks at 286, 717, 1086, 1420, and 1720 cm–1 correspond to the vibration of C-O in CO32– (the out-of-plane bending vibration, the in-plane bending vibration, the symmetric stretching vibration, the antisymmetric stretching vibration, and the coupled vibration mode, respectively) (Du and Fan, 2010).
The Raman spectrum of the red part of the imitation sample (figure 10, F1R) is attributed to the O-H bending vibration in the range of 1200–200 cm–1, including the Al-OH deformation vibration and the Al-O-Al bending vibration. Among them, the peak at about 1000 cm–1 is caused by δ(O-H) in-plane bending vibration, and the peak at 506 cm–1 is related to the γ(O-H) out-of-plane bending vibration. The 569 and 536 cm–1 peaks are attributed to the out-of-plane bending vibration of γ(Al-O-Al). And the δ(Al-O) bending vibration leads to the peak at 320 cm–1, plus a small shoulder at 306 cm–1. The Raman spectra come to the same conclusion as the infrared spectra.
The Raman shifts of the white part of the imitation sample (figure 10, F1W) are mainly located at 150, 280, 712, 1000, 1085, and 1600 cm–1. The Raman shifts at about 1000 and 1600 cm–1 are caused by the Al(OH)3 impurity in the white strip. The remaining absorption peaks at 150, 280, 712, and 1085 cm–1 are similar to those in the natural samples but slightly shifted. It is known that as the cation radius increases, the Raman shifts of the calcite group minerals that belong to νob, νib, and νs shift toward the short-wave (Du and Fan, 2010). Through comparison of the peak positions with Fu and Zheng (2013) and Du and Fan (2010), the peak at 150 cm–1 is due to the calcite lattice vibration, while the peaks at 280, 712, and 1085 cm–1 correspond to the C-O vibration of CO32– (the out-of-plane bending vibration, in-plane bending vibration, and symmetric stretching vibration, respectively). From this, we determined that the white part of the imitation is calcite.
CONCLUSIONS
Standard gemological testing was able to distinguish imitations from rhodochrosite by color, structure, band shape, transparency, and UV fluorescence. The imitation samples had brighter color, less-complex banding, lower specific gravity, lower RI, and poor transparency. SEM showed that the imitation had a granular structure, and its red and white parts contained different mineral powder particles. The FTIR, XES, XRD, and Raman spectra showed that the red part of the imitation product consists of granules of gibbsite (Al(OH)3) and the white band part is composed of calcite (CaCO3). Moreover, it is proposed that the matrix contains organic substances, possibly styrene or a similar compound.


