Colored Stones and Pearls
Tourmaline: A Gemstone’s Guide to Geologic Evolution of the Earth’s Crust
Barbara L. Dutrow
Louisiana State University, Baton Rouge
Tourmaline is recognized as an important gemstone and a stunning collector’s item, and each crystal contains geochemical fingerprints that can elucidate an astonishing array of geological processes. Through field, experimental, analytical, and theoretical studies, the rich chemical signature encapsulated in tourmaline is being unraveled and revealed. Because of its widely varying chemistry, tourmaline is particularly adept at recording the host-rock environment in which it grew, be it a melt, a marble, or a former subduction zone. In addition, it can record the thermal and baric conditions of its growth, acting as a geothermometer or geobarometer. A crystal that exhibits sector zoning can provide the complete temperature history of its growth, serving as a single-mineral thermometer. Other tourmaline compositions may reveal the absolute age of a geologic event that produced tourmaline formation.
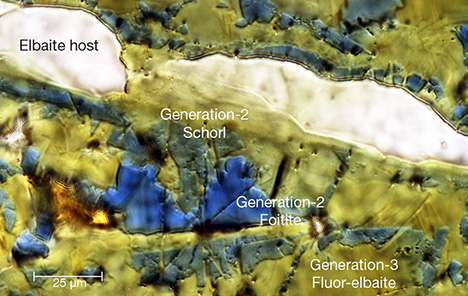
Tourmaline also excels at recording the evolution of the fluids with which it interacts. Its essential ingredient is boron (B), a fluid-mobile element. Thus, tourmaline is nature’s boron recorder. Tourmaline formation and growth reflects the availability of boron to the rock system. Fluids can be sourced internally from the melt or from the breakdown of other B-bearing minerals, or fluids with boron can infiltrate the rock system from external sources. In each case, tourmaline preserves signatures of these events in the form of new growth, dissolution of preexisting tourmaline with growth of a new tourmaline composition (tourmaline cannibalizing itself to form anew), or replacement of another mineral. Tourmaline species may hint at fluid compositions. For example, species ranging from oxy-dravite to povondraite are typically found in saline, oxidizing environments and are indicators of these fluids in the geologic past. The deep green chrome (Cr) tourmalines reflect an unusual environment enriched in both Cr and B. Similarly, tourmaline compositions may reflect specific components of the fluid phase and, in some cases, provide quantitative estimates of fluid compositions (figure 1). Fitting data to tourmaline–fluid partitioning experiments permits calculation of the sodium (Na) concentrations in the coexisting fluid phase, and suggests that the alkali species of tourmaline—elbaite, dravite, and schorl—form in fluids with greater than 0.30 mol/L Na, whereas the vacancy-dominant species, foitite and oxy-foitite, are stable in fluids with less than 0.25 mol/L Na. Once formed, tourmaline resists attack by corrosive acidic fluids.
Combining these features, tourmaline is a mineral containing unparalleled information on the environment in which it grew and the geologic processes responsible for it. An advantage of tourmaline as a geologic record keeper is that once these signals are incorporated, they are retained throughout the “lifetime” of the grain due to its slow volume diffusion. In some extraordinary cases, a single tourmaline grain can record its complete “life cycle,” from its original crystallization from a cooling magma deep within the crust through the rock’s uplift, cooling, and partial destruction during erosion to deposition and reburial followed by heating and regrowth in a new geologic environment. The oldest known tourmaline dates back about 3.7 billion years, and it retains the chemical growth zones from its formation in early Earth, thus elucidating the presence of boron-bearing fluids and continental crust during that time.
The totality of this embedded geologic history is the result of tourmaline’s flexible crystal structure, which incorporates a substantial number of chemical elements and isotopes, across a wide array of sizes and valence states, and in quantities from major to trace amounts. Such variable chemistry not only produces a kaleidoscope of colored gemstones but also permits tourmaline to be stable over nearly all pressure and temperature conditions found in Earth’s crust, and to develop in all major rock types, from solidified igneous melts and pegmatites to metamorphic and sedimentary rocks. This chemical variability classifies tourmaline as a mineral supergroup, currently consisting of 33 different species, each with a different and unique story.
Telling tourmaline’s story typically requires chemical compositions to be obtained. New methods involving laser ablation–inductively coupled plasma–mass spectrometry (LA-ICP-MS) and infrared and Raman spectroscopy, along with well-established techniques such as electron microprobe analysis, provide such information to gemologists and geologists. For tourmaline, a mineral with one of the most exquisite arrays of color, geologists tease apart the complex clues it harbors, and gemologists can use these to tell the story of each gemstone. The widespread occurrence of the tourmaline minerals and their ability to imprint, record, and retain information make them a valuable tool for investigating Earth’s geological processes. Tourmaline is the ultimate keeper of geologic information, a geologic DVD.
“Boehmite Needles” in Corundum Are Rose Channels
Franck Notari1, Emmanuel Fritsch2 (presenter), Candice Caplan1, and Thomas Hainschwang1
1GGTL-Laboratories Switzerland, Geneva, and Balzers, Liechtenstein
2Institut des Matériaux Jean Rouxel and University of Nantes, France
Crystallographically oriented, linear inclusions in corundum are often referred to as “boehmite needles” or “polycrystalline boehmite” (boehmite is the orthorhombic aluminum hydroxide g-AlOOH). These inclusions are oriented along the edges of the rhombohedral faces and form angles of about 90°. They are always found at the intersection of twin lamellae, formed by twinning along the rhombohedral faces. They contain apparently polycrystalline material tentatively identified (at least in some cases) as boehmite. These are common in natural corundum and sometimes used as a criterion to separate natural from synthetic corundum.
Boehmite can be recognized through its infrared absorption. The great majority of the “needle”-containing gem corundum showed no boehmite infrared absorption, thus leading us to believe that these inclusions have a different origin. Microscopic observation reveals three aspects: some are lath- or ribbon-shaped, others are clearly negative crystals, and sometimes they appear as dotted lines. At the outcrop of the feature on the gem’s surface there is most commonly a void that can be followed into the gem, so the “needle” is essentially empty. This feature was also documented in a flux-grown synthetic ruby with no boehmite infrared signal. These channels are favored during titanium diffusion and take on color first, as diffusion is much faster in the empty space.
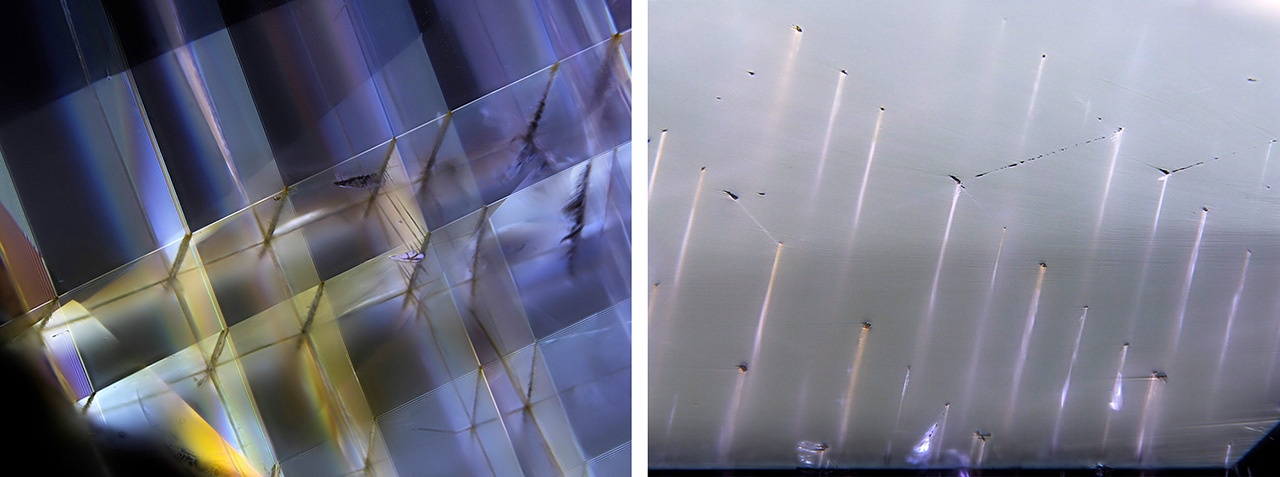
It is known that in a small number of materials—some metals, calcite, and diamond—hollow channels may form at the intersection of twin lamellae, caused by deformation twinning. This was discovered by Gustav Rose (1868) in calcite, and thus the features are called “Rose channels” (figure 1). We believe that “boehmite needles” are in fact Rose channels. Even when very small, these channels would explain the optical relief observed, without a change in chemistry or infrared absorption. They fit the crystallographic nature of the structures observed.
Gemstones and Photoluminescence
Claudio C. Milisenda
DSEF German Gem Lab, Idar-Oberstein
Laser- and ultraviolet-excited luminescence spectroscopy and imaging are important techniques for gemstone testing, as they are among the most sensitive spectroscopic methods (see Hainschwang et al., 2013). They are able to identify optically active crystallographic defects such as vacancies and substitutions that are present in such small amounts that they cannot be detected by any other analytical method. Photoluminescence (PL) analysis became particularly important in the last decade for the separation of natural from synthetic diamonds and the detection of treatments. Today the availability of specially designed and reasonably priced portable equipment enables the rapid in situ identification of mounted and unmounted natural diamonds.
Although PL spectroscopy is most commonly used for diamond identification, it can also be applied to colored stones. Some stones exhibit unique luminescence patterns, which can be used to identify the material. Other examples are the separation of natural from synthetic spinel and the detection of heat-treated spinel. Since chromium is a typical PL-causing trace element, it is also possible to separate chromium-colored gems such as ruby and jadeite from their artificially colored counterparts. The color authenticity of specific types of corals and pearls can also be determined.
The rare earth elements (REE) are among the main substituting luminescence centers in Ca2+-bearing minerals (Gaft et al., 2005). Recently, REE photoluminescence has been observed in cuprian liddicoatite tourmalines from Mozambique (Milisenda and Müller, 2017). When excited by a 785 nm laser, the stones showed a series of bands at 861, 869, 878, 894, and 1053 nm, consistent with the PL spectra of other calcium-rich minerals (Chen and Stimets, 2014). LA-ICP-MS analysis confirmed the REE enrichment in this type of tourmaline compared to cuprian elbaites from Brazil and Nigeria. As a result, photoluminescence can be used as a further criterion for origin determination of Paraíba-type tourmalines.
We have extended our research on other calcium-rich gems, including various grossular garnet varieties such as hessonite and tsavorite (figure 1), uvarovite garnet, apatite, titanite, and scheelite, as well as a number of high-refractive-index glasses and color-change glasses, respectively.

REFERENCES
Chen H., Stimets R.W. (2014) Fluorescence of trivalent neodymium in various materials excited by a 785 nm laser. American Mineralogist, Vol. 99, No. 2-3, pp. 332–342, https://doi.org/10.2138/am.2014.4311
Gaft M., Reisfeld R., Panczer G. (2005) Modern Luminescence Spectroscopy of Minerals and Materials. 2nd edition, Springer, Heidelberg, Germany, 606 pp.
Hainschwang T., Karampelas S., Fritsch E., Notari F. (2013) Luminescence spectroscopy and microscopy applied to study gem materials: a case study of C centre containing diamonds. Mineralogy and Petrology, Vol. 107, No. 3, pp. 393–413, https://doi.org/10.1007/s00710-013-0273-7
Milisenda C.C., Müller S. (2017) REE photoluminescence in Paraíba type tourmaline from Mozambique. 35th International Gemmological Conference, Windhoek, Namibia, pp. 71–73.
An Overview of Asteriated Gems: From Common Star Sapphire to Rare Star Aquamarine to One-of-a-Kind Star Zircon
Martin P. Steinbach
Steinbach–Gems with a Star, Idar-Oberstein, Germany
Rays of angel’s hair in a star-like shape, beams of light hovering over the surface of a gem—gems with stars have fascinated people of all cultures, continents, and religions since ancient times.
Asteriated gems have been known for more than 2,000 years, starting with Periegetes’ description of “Asterios” in the first century BCE. Other historical names were asteria, asterius, astrion, astrodamas, and astriotes. From Pliny the Elder (first century CE) to the Middle Ages, to De Boodt (1609) and Brueckmann (1783), asterism was known only in corundum and some feldspar varieties.

Currently, about 60 different gem varieties display asterism, whereas 15 gemstone varieties show a “trapiche” star. The well-known commercial examples include star ruby, sapphire, quartz, almandine garnet, moonstone (orthoclase feldspar), and the four-rayed black star diopside from India. Rare or less well-known varieties include star aquamarine, beryl, bronzite, calcite, chrysoberyl (A.G.S. Research Service, 1937), enstatite, hypersthene, kyanite, peridot, scheelite, scapolite, spinel, and sunstone (oligoclase feldspar). The extremely rare one-of-a-kind stars consist of star alexandrite, amazonite (Steinbach, 2016), cordierite, apatite, “star diamond,” ekanite, emerald (Liddicoat, 1977), kornerupine, kunzite, labradorite, opal, parisite, prehnite, rhodochrosite (figure 1), rhodonite, rutile, serandite, fibrolite (sillimanite), spessartine, taaffeite, tanzanite, topaz, tourmaline, and zircon.
Some of the 60 different star stones introduced in this colorful presentation can also show double stars; 12-, 18-, or 24-rayed stars; a network of stars; and trapiche varieties.
One new source of star rose quartz (China) and two new sources of almandine star garnet (China and Russia) will also be presented.
REFERENCES
A.G.S. Research Service (1937) Star chrysoberyl. G&G, Vol. 2, No. 8, p. 130.
Liddicoat R.T. (1977) Comments on the Hixon Collection. G&G, Vol. 15, No. 9, p. 1.
Steinbach M.P. (2016) Asterism—Gems with a Star. MPS Publishing and Media, Idar-Oberstein, Germany, 896 pp.
Quantitative Identification of Green Nephrite from Five Major Origins In Asia and North America
Zemin Luo, Andy H. Shen, and Meihua Chen
China University of Geosciences, Wuhan
Green nephrite (serpentine-related) has been generating substantial interest in the gem market. The primary sources are China, Russia, and Canada. Preliminary observations of mineral impurities and chemical components can help separate some dolomite-related nephrite from serpentine-related material. We have developed a novel classifier that can automatically identify the geological origin of random green nephrite samples on the market with 95% prediction accuracy. The technique behind this classifier is based on a trace-element database for green nephrite and a machine learning algorithm.

The green nephrite database was built from 34 samples from five major geological origins (Manasi and Hetian in Xinjiang, China; Taiwan; British Columbia, Canada; and Siberia, Russia; representative samples are shown in figure 1). Trace-element information was collected by LA-ICP-MS with an average of six points on each sample. The following classification models were tested: neural network (multilayer perceptron), random forest, logistic regression, naive Bayes, and support vector machine. The random forest model gives the best performance on both training sets and cross-validation sets, with over 90% accuracy (table 1). The random forest model also identified the 10 most important trace elements for green nephrite classification as Sr, Ba, Zn, U, Ti, LREE, Cd, Rb, Mn, and K (figure 2). The geological information about this trace-element “fingerprint” needs further investigation.

 of the training set and the cross-validation set for the five green nephrite samples using various machine learning algorithms.")
We used linear discriminant analysis (LDA) to visually demonstrate the obvious separation of Siberian and Manasi green nephrites from the other origins (figure 3). This result is consistent with our optic and spectra characterization results. Green nephrite from the Manasi mine usually presents a heterogeneous grayish yellow green color, which is quite different from that of other origins. The absence of garnet inclusions in Siberian green nephrite—which distinguishes it from material from the other localities—can be confirmed by Raman spectroscopy. Samples from all origins have been characterized by photomicrography, micro-infrared spectra, and Raman spectra. We can therefore integrate the spectra and trace-element features into our classification model in the next step. We believe that the research method proved in this work is also applicable for other gemstones. It can also be a useful tool to study ancient green nephrite origins.

Radiocarbon Measurements on Pearls: Principles, Complexities, and Possibilities
Gregory Hodgins
University of Arizona Accelerator Mass Spectrometry Laboratory, Tucson
Radiocarbon dating is a method for determining the age of organic remains formed in the past 45,000 years. Also known as carbon-14 or 14C (figure 1), radiocarbon is a naturally occurring radioactive isotope of carbon with a half-life of 5,730 years. It is continuously formed in the earth’s upper atmosphere and makes its way into the biosphere via photosynthetic uptake and the food chain. Several radiocarbon dates for pearls have recently appeared in the scientific literature. Mollusks take up radiocarbon during life and incorporate it into shell and pearl carbonate. The aim of this presentation will be to describe the method, identification complexities, and challenges inherent in dating pearls based upon radiocarbon measurement so that we may plot a path for future research.

There are two variants of the dating method. The first is conventional radiocarbon dating, which applies to organisms that lived before 1955 CE. The second involves the detection of anthropogenic radiocarbon in organisms living between 1955 CE and the present. There are biological, environmental, and experimental complexities in the radiocarbon dating of pearls, and the method will not work in all circumstances. However, some of these complexities—coupled with historic changes in when, where, and how pearls have been produced—mean radiocarbon measurement can provide information unavailable by other means.
Unconventional Techniques in Pearl Testing: Their Potential and Limitations
Chunhui Zhou
GIA, New York
Current routine pearl testing involves the application of various basic and advanced gemological techniques. These include the use of the gemological microscope, ultraviolet (UV) luminescence, microradiography, computed X-ray microtomography, optical X-ray luminescence, energy-dispersive X-ray fluorescence spectrometry (EDXRF), ultraviolet-visible (UV-Vis) spectroscopy, and Raman spectroscopy. While the majority of pearls may be identified using these existing conventional techniques, in certain cases identification challenges remain.

This talk will discuss the potential and limitations of various unconventional techniques that have been applied to pearl testing over recent years. Some of these techniques have been explored by GIA and resulted in meaningful benefits to the trade, and others referenced in the literature will also be briefly covered. Examples of these techniques include radiocarbon age dating, deoxyribonucleic acid (DNA) bar coding, in-depth trace-element geochemistry and isotope analysis, and 3D reconstruction of internal structures. It is important for gemological and research institutions to continue developing novel techniques for pearl testing in order to achieve the accurate separation between natural and cultured pearls, principally non-bead cultured, as well as other aspects of identification that might assist in reaching this accurate analysis (e.g., species determination, geographical origin determination, and treatment identification). Despite decades of pearl testing experience, some challenges remain within laboratories, and the application of additional unconventional methods could resolve some of these issues.
ADDITIONAL READING
Krzemnicki M.S., Hajdas I. (2013) Age determination of pearls: A new approach for pearl testing and identification. Radiocarbon, Vol. 55, No. 3, pp. 1801–1809, http://dx.doi.org/10.1017/S0033822200048700
Meyer J.B., Cartier L.E., Pinto-Figueroa E.A., Krzemnicki M.S., Hänni H.A., McDonald B.A. (2013) DNA fingerprinting of pearls to determine their origins. PLOS One, Vol. 8, No. 10, pp. 1–11, http://dx.doi.org/10.1371/journal.pone.0075606
Saruwatari K., Suzuki M., Zhou C., Kessrapong P., Sturman N. (2018) DNA techniques applied to the identification of Pinctada fucata pearls from Uwajima, Ehime Prefecture, Japan. G&G, Vol. 54, No. 1, pp. 40–50, http://dx.doi.org/10.5741/GEMS.54.1.40
Zhou C., Hodgins G., Lange T., Saruwatari K., Sturman N., Kiefert L., Schollenbruch K. (2017) Saltwater pearls from the pre- to early Columbian era: A gemological and radiocarbon dating study. G&G, Vol. 53, No. 3, pp. 286–295, http://dx.doi.org/10.5741/GEMS.53.3.286
What Is Cobalt Spinel? Unraveling the Causes of Color in Blue Spinels
Aaron C. Palke and Ziyin Sun
GIA, Carlsbad, California
Cobalt is known to produce vibrant blue color in both natural and synthetic spinel. In the 1980s and ’90s, Vietnam started producing blue spinel with very high concentrations of cobalt and bright, saturated color rivaling that seen in synthetic material. Iron can also cause blue coloration in spinel, although this is typically a duller grayish or greenish blue. So when is a blue spinel worthy of carrying the “cobalt spinel” moniker? With high-sensitivity analytical methods such as LA-ICP-MS, cobalt can be detected in most spinel, even at the sub-ppm level. But sub-ppm concentrations of cobalt do not impact the color of a faceted spinel. In addition, the saturation and quality of blue color will depend on the concentration of iron and its valence state (e.g., Fe2+ vs. Fe3+).
In this contribution we will explore the color space of blue spinel and outline the various contributions to their coloration. Using UV-Vis spectrometry and LA-ICP-MS on blue spinel from Vietnam, Sri Lanka, Madagascar, and Tanzania, we have isolated three unique and consistent chromophores (see figure 1). Cobalt in its divalent form (Co2+) has multiple absorption bands between ~510 and 660 nm and produces a bright blue color. Two broad absorption bands at ~650 and 920 nm are related to Fe2+ substituting for Al3+ in octahedral coordination. Finally, another set of at least three absorption bands occurs at ~500–620 nm and overlaps those from Co2+. Comparison with other Fe-related absorption bands and consideration of the crystal chemistry of spinel suggest that these bands may be related to Fe3+ in the tetrahedral site in the spinel structure. This last absorption feature creates a grayish pink coloration, and in combination with Co2+ it can be responsible for blue to violet color change in some spinel. There is clearly a significant interplay between these three chromophores, and a full understanding of the causes of color in blue spinel can only be attained by consideration of all three contributions.


