New Technologies and Techniques

Beyond the Four Cs Basics Towards Core Diamond Values
Alexander Mosyaikin1 and Janak Mistry2
1OctoNus Software, Moscow
2Lexus SoftMac, Surat, India
Diamond grading systems continuously evolve towards more precise descriptions for relevant discussion and comparison. The basis consists of the Four Cs: carat weight, cut, clarity, and color.
Nowadays, consumers often look for clues beyond the Four Cs. The important and unique polished diamond features for end users comprise the next level of diamond description. In figure 1 (left), the central four tiles represent the Four Cs graded by the labs: pavilion color, clarity grade, polishing and microsymmetry, and carat weight. The outer tiles are the advanced diamond descriptions based on the unique core diamond features such as brilliance, fire, and table color.
These additional descriptions might provide critically important information for making decisions in cases of
- Diamonds with identical Four Cs grading reports but differences in beauty and value
- The design of jewelry pieces for balance in fire, brilliance, scintillation, and other factors
- Uncertainty about a grading report’s authenticity
- Comparing the optical performance of round and fancy cuts
The DiBox 2.0 makes users fluent in a new tier of diamond language. It generates diamond photos (figure 1, right) and videos for professional testing and specific consumer environments (e.g., office, sunlight, nightclub). Controllable long-wave ultraviolet (UV) diodes, along with full-spectrum-visible light-emitting diodes (LEDs) create different lighting conditions (indoor, outdoor, lab, UV-free), revealing the impacts of UV fluorescence on diamond transparency and color. The selection of lighting conditions includes Fire, Office, ASET/Ideal Scope, Hearts & Arrows, Fluorescence in Long-Wave UV, White Dome Lighting, Darkfield, and Brightfield. The DiBox 2.0 takes 3D videos, allowing virtual appreciation of diamonds remotely in a way that is much closer to reality. DiBox 2.0 images, along with the precise Helium Polish scanner 3D model, can be used to simplify clarity plotting.
The DiBox 2.0 also captures data for automatic assessment algorithms. Brilliance and Optical Symmetry beauty metrics are already available through the Cutwise web platform. These metrics allow the user to compare optical performance of diamonds with different sizes and cuts (round and all fancies) using core consumer values, which form the higher tier of the diamond description system.
Creating Gems Using the Zirconia Sintering Process
Etienne Perret
Ceramique by Etienne Perret, Camden, Maine
Whereas most of us are familiar with the hydrothermal and flux-melt solution methods for growing crystal forms of zirconia, these are not the only way to create gem forms from this material. Using the sintering process, zirconia powder can be baked at high temperatures to create three-dimensional objects.

Sintered zirconia (figure 1), also known as zirconia ceramic, is used in many medical and industrial applications. Zirconia ceramics are now successfully used in the watch and jewelry industry. Its relatively low cost and high durability make it an ideal alternative to precious metals. A wide range of colors in addition to white and black can be achieved by adding trace elements to the zirconia powder before it is sintered. All these factors make zirconia ceramic an extremely interesting material to consider in the manufacture of jewelry.
Fluorescence Spectroscopy for Gemstone Screening and Identification
Tsung-Han Tsai
GIA, New York
Gemologists are always looking for fast, accurate, and cost-efficient methods and tools to identify gem materials. Fluorescence spectroscopy is a highly efficient way to detect a gemstone’s defects or impurities, while the characteristic fluorescence response can be used to identify the gemstone. Therefore, this rapid technology has the potential to be used to separate natural diamonds from laboratory-grown diamonds and diamond simulants, detect multi-treated pink diamonds, and identify colored gemstones. This technique can be applied to test both loose samples and mounted jewelry pieces. An experimental prototype has been built to test the concept of using fluorescence spectroscopy under room temperature for gemstone screening. The device uses a UV LED as the light source. Optical short-pass and long-pass filters are installed between the light source and the spectrometer to isolate the fluorescence from the excitation. Optical lenses are used to focus the UV source into the reflection fiber probe and then couple the fluorescence into the spectrometer. The prototype uses a reflection fiber probe to enhance the flexibility of sample positioning, allowing the user to easily target individual mounted or unmounted gemstones.

To test the performance of the prototype and the screening software, we measured more than 10,000 samples including natural diamonds, diamond simulants, laboratory-grown diamonds, treated pink diamonds, and colored gemstones such as ruby, sapphire, emerald, spinel, and zoisite to confirm the detection rate of this device. Figure 1 shows the fluorescence spectra of natural diamond, multi-treated pink diamond, and various colored stones. The prototype detected 97% of natural diamond, and referred 100% of diamond simulants and both HPHT and CVD laboratory-grown diamonds for further testing. In pink diamond identification, 99% of natural pink diamonds were detected, while multi-treated pink diamonds and pink laboratory-grown diamonds were 100% referred. Finally, the device detected 93% of corundum, 97% of emerald, 93% of spinel, and 81% of zoisite.
From Screening to D-tection
Marleen Bouman, Ellen Biermans, and Ans Anthonis
HRD Antwerp
Screening diamonds by type is a safe way to sort potentially lab-grown colorless diamonds from natural diamonds. Nevertheless, in many cases the referral rate is too high. Therefore, HRD Antwerp has introduced the use of D-tect, a new screening device that forms a perfect complement to the M-screen+. D-tect is a nonautomated device based on UV luminescence imaging and photoluminescence spectroscopy (PL) at room temperature and liquid nitrogen (LN) temperature. In combination with M-screen+, this instrument offers the ultimate assurance of distinguishing all laboratory-grown diamonds from natural ones.

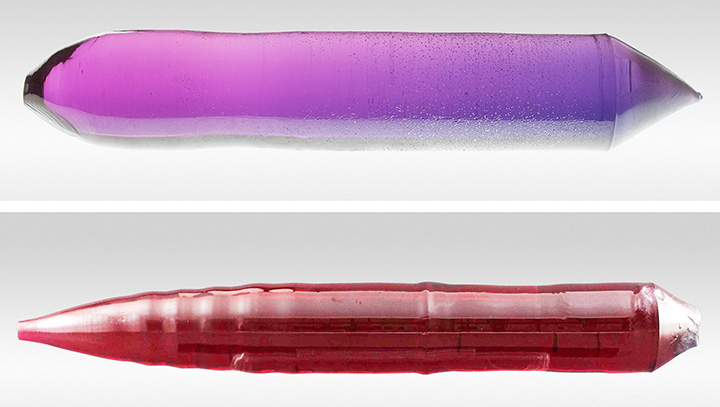
In this study, we investigated a parcel of 150 melee-sized CVD-grown diamonds, focusing on features that are challenging for up-to-date screening devices. D-tect checks the SiV– doublet and the 467 nm defect, defects typically seen in CVD laboratory-grown diamonds. At LN temperatures, it is possible to see even the weakest SiV– doublet. This feature, in combination with the presence of the 467 nm defect, identified all of the CVD specimens, even those with uncharacteristic fluorescence colors. An example of a CVD-grown diamond with purple fluorescence and no phosphorescence is given in figure 1.
Image Analysis Techniques Applied to Clarity Issues
Troy Blodgett1 and Andrew Regan2
1GIA, Flagstaff, Arizona
2GIA, New York
GIA’s research in clarity image analysis began around the year 2000 with capturing high-resolution still images to explore whether 2D images could be used as an alternative to clarity plotting. GIA also examined the potential of using image analysis and inclusion-capture algorithms for predicting a clarity grade. Based on this early research, we developed the Imaging System for Automated Clarity (ISAC), which required an operator to select a region of interest encompassing an inclusion and choose the predicted result that best represented the inclusion so that the device could predict a clarity grade. Note that this application pertained mainly to diamonds with single inclusions, although there was a supplemental entry field to adjust the predicted clarity grade if reflections or additional inclusions were reported.
From the ISAC research ending in 2007, a number of patents were filed that same year. The ISAC designs were subsequently re-engineered for a production environment, leading to the implementation of a device for producing images on the eReport in 2012. Further experiments were run on high-resolution manually “stacked” composite images using textural analysis, which showed considerable promise. GIA has undertaken extensive testing of various production-friendly imaging instruments (e.g., Keyence Microscope, Lexus-OctoNus Dibox, and Sarine Loupe) to see which ones could produce images suitable for automated clarity analysis. Artificial neural nets, a type of machine learning, were trained to recognize the shape and texture of inclusions. Examples of such plots are shown in figure 1.

In addition to plotting features, neural nets have also learned to apply clarity factors such as relative size, number, relief, and position of inclusions to calculate a clarity grade. For predicting a grade, the artificial neural nets were trained on a portion of the crown-view images and the remaining images tested the clarity grade prediction. About 70% of the predicted grades matched the clarity grades provided by graders (evaluating the images) when IF–VVS ranges were lumped together and I1, I2, and I3 were clustered. Distinguishing IF and VVS grades likely requires more information from both the pavilion and girdle views. There were not enough I2 and I3 images available to treat those grade ranges as separate categories. GIA considers 3D information important for clarity evaluation. Images of the crown tilted to varying degrees were used to estimate inclusion depth. Results from the 2D clarity plot, inclusion depth information, and a 3D wireframe model can be combined to render a preliminary 3D clarity plot. Future research will be conducted to add more 3D information from the pavilion view to improve the accuracy of the 3D clarity plot and shed more light on the most challenging IF–VVS clarity range.
Matrix-Matched Standards for Trace-Element Analysis in Ruby and Sapphire
Jennifer L. Stone-Sundberg1, Timothy Thomas2, Zachary Cole3, Yunbin Guan4, Ziyin Sun5, Troy Ardon, and John L. Emmett6
1GIA, Portland, Oregon
2Applied Materials, Hillsboro, Oregon
3Scientific Materials Corporation, Bozeman, Montana
4California Institute of Technology, Pasadena
5GIA, Carlsbad, California
6Crystal Chemistry, Brush Prairie, Washington
As reported recently (Stone-Sundberg et al., 2017), GIA has created sets of highly accurate matrix-matched corundum standards for laser ablation–inductively coupled plasma–mass spectrometry (LA-ICP-MS) analysis as an alternative to NIST glasses. These standards cover applicable ranges of the key trace elements found in natural ruby and sapphire: Be, Mg, Ti, V, Cr, Fe, and Ga. The concern with using non-matrix-matched standards to quantify trace elements in corundum is twofold: (1) Calibrating with a matrix differing in composition and structure will result in dissimilar interferences and ablation characteristics, which will negatively impact the quantification process. (2) The differences in ratios of matrix elements and trace elements of interest between the non-matrix-matched standard and the samples will result in calibration errors. Possibly the most concerning issue for applying NIST glass standards to quantifying many trace elements in corundum is the fact that they simply are not certified for most of the elements of interest.
To ensure the highest accuracy possible, we created and characterized individual ion implant standards for each trace element of interest in corundum, calibrated a secondary ion mass spectrometer (SIMS) with these implants, and then calibrated each individual corundum standard piece using SIMS. We turned to Czochralski growth to produce large and highly uniform multi-doped crystals for these standards (figure 1). The standards sets include two multi-doped pieces of synthetic sapphire to capture relevant levels of Mg, Ti, V, Cr, Fe, and Ga; a highly uniform piece of Yogo sapphire to capture a greater level of Fe than we could generate synthetically; and an ultra-high-purity synthetic sapphire “blank” with a combined total of less than 0.5 ppma of the key trace elements mentioned above. To incorporate Be, pieces from one of the multi-doped crystals were beryllium diffused for 100 hours at 1800°C in pure oxygen. Each piece for the standards set was screened to ensure high homogeneity.
GIA has been using these standards for more than a year in its colored stones laboratories and is working to make these standards available outside of GIA. We have also been focusing on optimizing the LA-ICP-MS operating protocols throughout our labs to identify the best conditions for gemological applications. The adoption of these standards by other labs will help in creating industry-wide uniformity when it comes to reporting key trace-element data for ruby and sapphire.
REFERENCE
Stone-Sundberg J., Thomas T., Sun Z., Guan Y., Cole Z., Equall R., Emmett J.L. (2017) Accurate reporting of key trace elements in ruby and sapphire using matrix-matched standards. G&G, Vol. 53, No. 4, pp. 438–451, http://dx.doi.org/10.5741/GEMS.53.4.438
Novel Method of Diamond Color Grading by Raman Spectroscopy
Joe C.C. Yuan1, Ju-Tsung Liu2, and Gavin D.S. Pan3
1Taidiam Technology (Zhengzhou) Co., Ltd., China
2Taiwan Food and Drug Administration
3United ID Raman Lab, Taipei
A nondestructive and rapid diamond color-grading method is proposed based upon the 2030 cm–1 characteristic Raman peak. The intensity of this N-C bonding peak for natural untreated “cape” diamonds (type Ia, IIa) is strongly associated with the observed color. When the intensity of the 2030 cm–1 peak is normalized against that of the second-order diamond bond peak at 2666 cm–1, this can be used as a basis for the color grading of cape diamonds, both loose and mounted. The characteristic Raman peak of diamond at 1332 cm–1 corresponds to the vibration mode of the C-C bond. However, the C-N bond peak at 2030 cm–1 (Nyquist et al., 1997; Dana et al., 2004) can reveal information related to the diamond’s color. The 1800–2800 cm–1 spectral range clearly shows additional second-order Raman peaks at 2180, 2256, 2336, 2462, 2490, and 2666 cm–1. The coexistence of the 2030 cm–1 peak and second-order peaks in the overlaid spectrum was seen in all 50 type Ia diamonds examined in this study.
To test this approach, we examined a set of eight certified GIA color master diamonds with grades of E, F, G, H, I, J, K, and L. We collected Raman data in the spectral range between 1600 and 2800 cm–1 and normalized the 2666 cm–1 peak in each data set to 1,000 counts so that we could observe the variation in the 2030 cm–1 peak relative to it. The normalized intensity of the 2030 cm–1 peak clearly increased with increasing yellow tint. A linear relationship was observed when plotting normalized 2030 cm–1 peak intensity versus color grade.
The 2030 cm–1 Raman peak in nitrogen-containing type Ia and IIa cape diamonds is considered to be related to C-N bonding and is consistent with reports of other C-N bond vibration modes at 2030 cm–1, such as in Pb(SCN)2 (Nyquist et al., 1997; Dana et al., 2004). To date, the assignment of the 2030 cm–1 peak as N-related mode does need further research work, which is beyond the scope of this research.
This 2030 cm–1 peak may be overlooked or undetectable by conventional Raman spectrometers due to its low intensity relative to the C-C bonding mode. The instrumentation used in our study has an exceptionally high sensitivity, with S/N > 10,000, supplemented by Auto Baseline Software System, which allows us to detect and analyze this bond mode.
This method for color grading cape diamonds is rapid and nondestructive, with no requirement for sample preparation. It may serve as a novel and semi-quantitative method complementing the conventional colorimetric method. It cannot be applied to HPHT-treated diamonds because the fragile C-N bond peak at 2030 cm–1 may be totally or partially destroyed by the treatment.
REFERENCES
Mayo D.W., Miller F.A., Hannah R.W. (2004) Characteristic frequencies of molecules with triple bonds and cumulated double bonds. In Course Notes on the Interpretation of Infrared and Raman Spectra. John Wiley & Sons, Hoboken, New Jersey, pp. 85–99.
Nyquist R.A., Putzig C.L., Leugers M.A. (1997) Handbook of Infrared and Raman Spectra of Inorganic Compounds and Organic Salts. Academic Press, San Diego, California, pp. 1–14.
Quantitative Determination of Cr3+ and V3+ Contents in Rubies by Spectral Fitting of UV-Vis-NIR Spectra
Tom Stephan1,2, Tobias Häger2, Ulrich Henn1, and Wolfgang Hofmeister2
1German Gemmological Association, Idar-Oberstein
2Center for Gemstone Research, Johannes Gutenberg-University, Mainz, Germany
For this study, the ultraviolet/visible/near-infrared (UV-Vis-NIR) absorption spectra of various natural and synthetic rubies and sapphires were mathematically decomposed into Gaussian and Lorenz curves. For this purpose, we used MagicPlot Pro curve fitting software.
With the help of synthetic corundum samples that were colored respectively by Cr3+ or V3+, we developed two models that allow a comparable and reproducible description of the UV-Vis-NIR spectra (see figure 1). The applicability of the models, the transferability to the absorption spectra of natural rubies and sapphires, and the correlation with chemical analyses were successfully tested.

The investigations showed that by the use of such models and knowledge of the samples’ thickness, it is possible to determine concentrations of coloring trace elements (in this case chromium and vanadium) quantitatively from the absorption spectra. Additionally, the simultaneous application of Cr3+ and V3+ models is also possible, despite the superposition of the absorption bands of both chromophores. Therefore, the detection of vanadium in rubies is made possible even at low concentrations. This allows first information on the samples’ origin.
Additional information can be obtained from the absorption spectra, such as:
- Exact position and shape of the cutoff (absorption edge toward the UV region)
- The strength of the Tyndall effect, to estimate the concentration and size of the light-scattering inclusions
- Detection of underlying color causes
The investigations are part of the first author’s ongoing PhD thesis. The work’s aim is a model for each cause of color in corundum, which would allow a simultaneous quantification of the concentration of the involved chromophores—as well as for mixed colors. We have also tested the applicability for faceted samples. The first results show that fitting is possible, with appropriate sample orientation.
Additionally, comparable models for other gemstones incorporating Cr3+ and V3+ (e.g., emerald, tourmaline, and garnet) will be developed and tested.
A Simplified Species Classification for Gem-Quality Tourmaline by LA-ICP-MS
Ziyin Sun1, Aaron C. Palke1, Christopher M. Breeding1, and Barbara L. Dutrow2
1GIA, Carlsbad, California
2Department of Geology and Geophysics, Louisiana State University, Baton Rouge
In the trade, gems from the tourmaline species are often identified by sight based on the typical colors of the various species rather than accurate chemical analyses. However, the same color can be exhibited by several different species. In other words, tourmaline color is not species specific. Electron microprobe analysis is the most widely accepted method to determine tourmaline species. Unfortunately, it is also expensive and time-consuming. Most gemological laboratories are not equipped for it and cannot justify the overhead costs associated with outsourcing this analysis. Therefore, the electron microprobe is not a practical everyday tool for a gemological laboratory. Here, we present a comprehensive method for using LA-ICP-MS analyses to accurately determine tourmaline species. The new method allows for inexpensive, clean, fast, and largely nondestructive analysis of tourmaline chemistry. With this method, we are able to produce LA-ICP-MS data for major and minor element concentrations in tourmaline that closely match values determined by electron microprobe (within ±10% error). The ability to accurately measure the range of chemical compositions found in gem tourmaline using LA-ICP-MS allows GIA to help the colored stone industry better understand the varieties of tourmaline being bought and sold.

Swept-Source Optical Coherence Tomography for Imaging the Internal Structure of Pearls
Nick DelRe1, Nate Kemp2, Joey Jabbour2, and Andres Zuluaga2
1Gemological Science International, New York
2Axsun Technologies, Billerica, Massachusetts
The popularity of pearls (figure 1, left) over the centuries led to their cultivation to meet marketplace demand. This has resulted in numerous pearls and pearl imitations that at times prove to be an identification challenge, even when using X-ray tomography. Some examples include the differentiation of certain kinds of natural vs. cultured pearls. The difficulty is compounded because pearls must be tested nondestructively, a cornerstone of gemology.
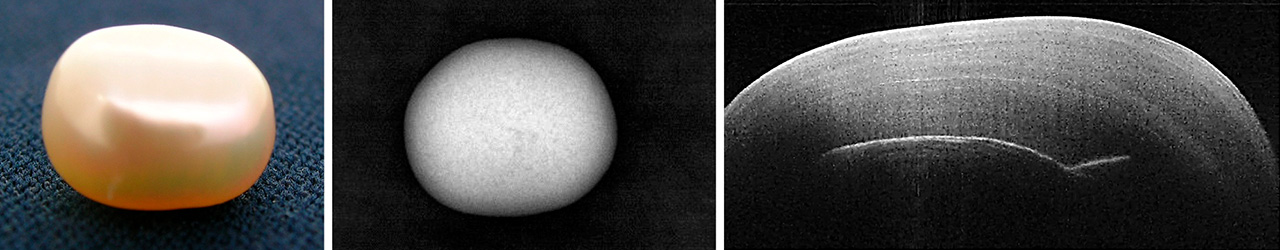
Traditionally, the internal structure of pearls has been examined by radiography. This imaging method uses X-rays (figure 1, center), which are at the higher-energy end of the electromagnetic spectrum. This technique generates two- and three-dimensional images. To get a clearer picture of the internal structure, 3D images are generated by computed tomography (CT), where multiple 2D images from different angles undergo computer processing. The time to generate an image with good resolution can vary from seconds to several minutes. While passing through the pearl, a certain amount of X-ray radiation is absorbed (dependent on the pearl’s density and structural composition) as well as scattered. Although the radiation is not harmful, there may be a slight degree of ionization occurring when the X-rays are absorbed by the pearl. In addition, the operator must take safety measures while working with ionizing radiation.
Here we present an alternate form of imaging that uses the lower-energy end of the electromagnetic spectrum, namely the near-infrared region. Optical coherence tomography (OCT; figure 1, right) is a noninvasive, micron-resolution cross-sectional scanning of visually translucent to opaque structures. It allows live 3D imaging of sample morphology without sample preparation or exposure to ionizing radiation. OCT fills the imaging gap between ultrasound and MRI (deeper coverage and lower spatial resolution) on one end, and confocal microscopy (shallower coverage, higher spatial resolution) on the other. It can be likened to sonar or medical ultrasound, but using light waves instead of sound waves. OCT has proved very successful in ophthalmology and cardiology applications.
In this technique, a beam of light (typically in the near-infrared spectrum) is used to scan the sample. Coherence refers to the fact that an interferometric, low-coherence technique is used for depth discrimination. Tomography means cross-sectional imaging. To further explain the basic optical setup, the light is split between two arms, one for the sample and one for the reference mirror. The reflected beam from the sample and the reflected beam from the reference mirror interfere with each other. That interference represents the intensity of the reflection from a specific depth in the sample. In classic time-domain OCT, scanning the position of the reference mirror in the interferometer allows the interference signals from different depths to be acquired and processed, thus forming an axial line representing the intensity of reflections from each depth in the sample. In swept-source OCT, a laser source produces a rapid sweep of wavelengths (colors). For each wavelength, an interference pattern is formed. This interference pattern can be processed with exquisite sensitivity, leading to exceptional rejection of signals from depths outside the detection window.
In the case of the 3D data presented here, a pair of galvanometer scanners were used to scan the light in two directions perpendicular to each other and both perpendicular to the depth direction (see the table for the scanning systems’ specifications). Although there have been attempts in the past 20 years to apply OCT technology for pearl examination, none have garnered sufficient interest. Part of this has to do with the cost-effectiveness of this technology for commercial use. In addition, the resulting imaging was still not suitable for pearls, since the penetration depth and sensitivity from available systems was insufficient. Our studies have demonstrated the exceptional performance of a compact and cost-effective advanced swept-source OCT system in delivering high-quality noninvasive 3D images of pearls in real time.


