Infrared Spectroscopic Study of Filled Moonstone
ABSTRACT
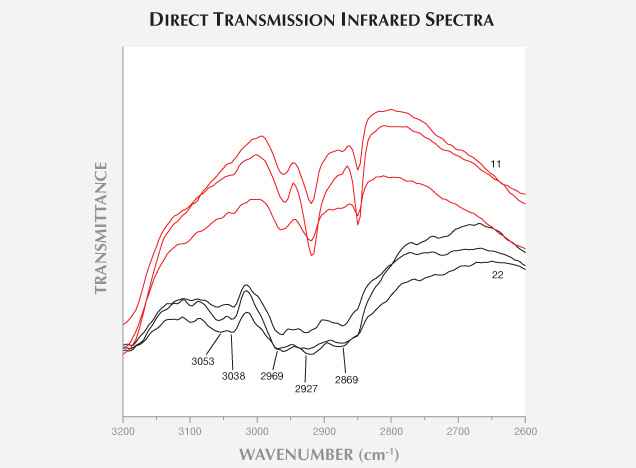
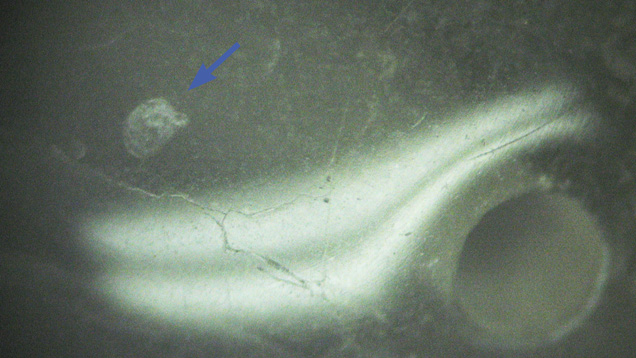
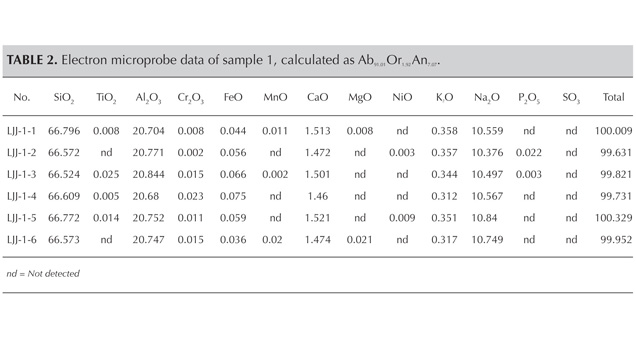
The laboratory of the National Gold & Diamond Testing Center (NGDTC) encountered some plagioclase (moonstone) beads with blue adularescence. Fifteen of the 22 moonstones fluoresced moderate to strong bluish white to long-wave UV, with the fluorescence visible in fissures. Electron microprobe analysis of one bead and micro-infrared reflectance spectra of all 22 samples indicated a composition nearly identical to albite. The specimens with strong fluorescence exhibited 3053 and 3038 cm–1 peaks in their direct transmission infrared spectra, confirming impregnation by a material with benzene structure. This treatment can be detected with a standard gemological microscope by observing characteristics such as relief lines.
In identifying gemstones from the Chinese market over the last five years, the National Gold & Diamond Testing Center (NGDTC) found that some treatments usually applied to top-grade colored stones such as emerald (Johnson et al., 1999) or jadeite jade (Fritsch et al., 1992) had also been used to enhance other materials. Impregnated aquamarine, tourmaline, and kyanite have all been encountered. Li et al. (2008) examined the characteristics and identifying features of filled aquamarine. Wang and Yang (2008) reported on a filling technology applied to carvings, beads, and faceted gems from the jewelry market of Guangdong Province. They also researched the identification of these filled gemstones.A few months ago, the NGDTC laboratory received from a client six bracelets of plagioclase (moonstone) beads with blue adularescence. The bracelets were reportedly from Donghai County in Jiangsu Province, the trading center for crystal quartz. They displayed moderate to strong bluish white fluorescence in an irregular curvilinear pattern, which caused suspicion. Observing the beads from different directions showed that the fluorescence was confined to the fractures, and the authors deduced the presence of some foreign material. In addition to determining the mineral composition of the samples, we collected infrared spectra to confirm the existence of the filling material and examine its composition.
MATERIALS AND METHODS
The samples came from a strand of 22 moonstone beads (table 1) that showed beautiful blue adularescence (figure 1). We examined the samples’ standard gemological properties using an Abbe refractometer, an ultraviolet fluorescence lamp, and a microscope.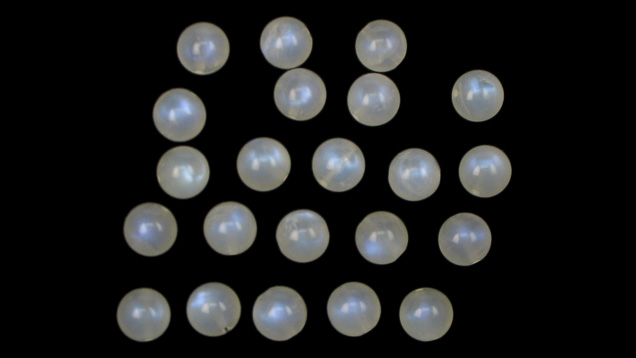
The chemical composition of sample 1 was first determined by electron microprobe analysis at the Chinese Academy of Geological Sciences (CAGS). The sample was removed from the strand, and a flat surface was polished oblique to the lamellae of polysynthetic twinning. After the electron microprobe analysis we could still see the strongest adularescence of this sample and collect its infrared spectra for further tests. CAGS used a JXA-8230 electron microprobe with an accelerating voltage of 15 kV, a beam current of 20 nA, and a beam diameter of 5 µm. Jadeite was used as the Na standard, and Na was run before the other elements to avoid undercounting sodium. The standard materials for this test were natural minerals and synthetic oxides, and the detection limit was about 100 ppm.
The 22 samples, including sample 1, were also tested at NGDTC with a Nicolet Nexus 470 Fourier transfer infrared spectrometer. To collect the microscopic reflective infrared spectra, we used an MCT/B detector. A total of 32 sample scans were taken at a resolution of 8.0 cm–1 and a background gain of 4.0. The Omnic 6.1a software recommends a scanning wavenumber range of 4000–650 cm–1, and the infrared spectrometer extended that range to 7800–400 cm–1.
Given the test requirements of the functional group (4000–2000 cm–1) and the fingerprint region of silicate minerals in reflective infrared spectroscopy, the scanning wavenumber range was set at 1300–500 cm–1.
Thompson and Wadsworth (1957) used infrared spectroscopy to determine albite and anorthite proportions in plagioclase. Li Jianjun et al. (2007) showed that the infrared spectra will vary when the samples are tested in different orientations. Thus the authors sought to obtain infrared spectra from a consistent crystal orientation to determine whether the samples had the same composition. We used a simple orientation method: With the light source directed from the viewpoint, we looked for the area where the blue adularescence was the strongest and recorded the micro-infrared reflective spectra of each sample from the same orientation. Because the chemical composition of sample 1 was determined by both EPMA and microscopic reflective infrared spectroscopy, comparing the spectra of all other samples to that of sample 1 allowed us to determine whether they had the same composition.
Direct transmission was then applied to each whole bead to test the existence of the filling material using a DTGS KBr detector. A total of 32 sample scans were taken at a resolution of 8.0 cm–1, a background gain of 1.0, and a scanning range of 7000–400 cm–1. With air as the background, we collected the spectra of infrared rays through each whole bead.
RESULTS AND DISCUSSION
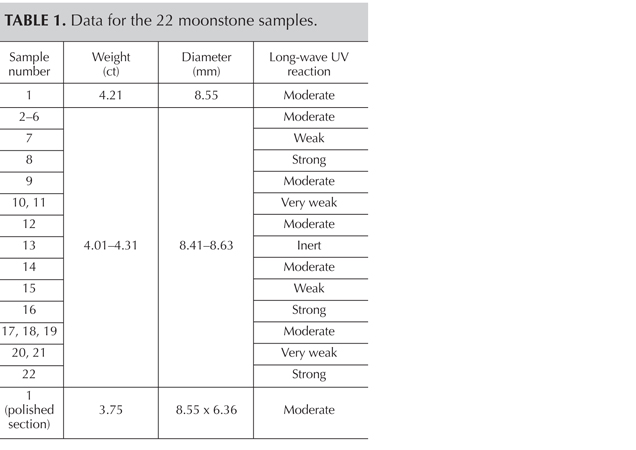
Gemological Properties. The samples’ spot refractive index (RI) was approximately 1.53. The RI of the polished surface on sample 1 was 1.530–1.535. Because each sample contained a hole for stringing, specific gravity was not measured due to the possible complication caused by the holes. Most samples fluoresced weak to moderate blue-white to long-wave UV (table 1; figure 2 left). Only one sample was inert to long-wave, while three displayed strong fluorescence. Under short-wave UV their fluorescence was weaker or inert (figure 2, right). Because the fluorescence was visible along the fissures, we deduced that there might be some foreign material within them. Large fissures would contain more foreign substance, producing stronger fluorescence while the beads with no fissures were inert under UV fluorescence lamp.
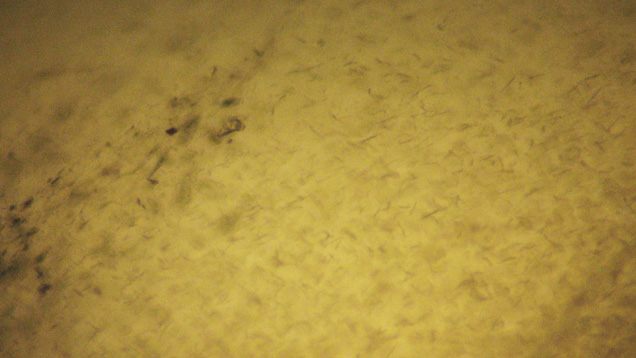
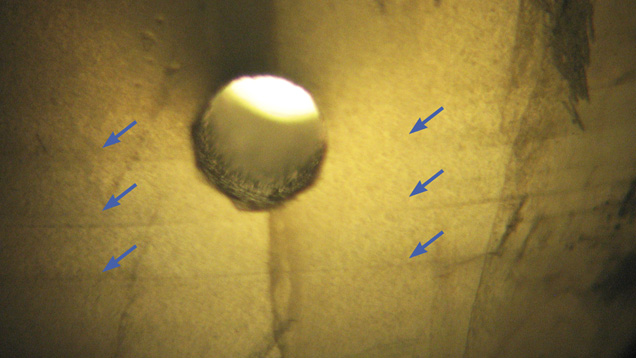
Figure 4. Fine internal parallel layers (polysynthetic twins) were observed with brightfield illumination. The circular feature near the center is a hole for stringing. Photomicrograph by Li Jianjun; magnified 30×.
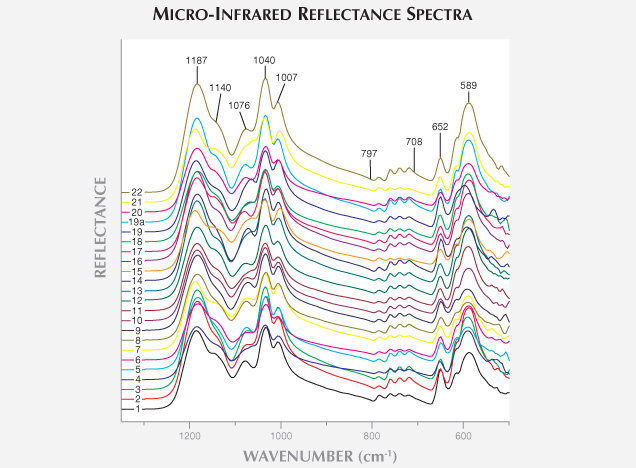
Infrared Spectroscopy Analysis. As figure 6 demonstrates, the 22 samples had very similar micro-infrared reflection spectra when they were collected at the strongest iridescence area (perpendicular to the polysynthetic twinning plane). This means the samples had identical mineral composition. As figure 6 demonstrates, the 22 samples had very similar micro-infrared reflection spectra when they were collected at the strongest iridescence area (perpendicular to the polysynthetic twinning plane). This means the samples had identical mineral composition.
1200–900 cm–1: This region shows the Si-O stretching vibration bands in SiO4 tetrahedral polymers (Zhang et al., 1986). The 22 samples generally shared the same peaks or shoulders: 1187, 1040, and 1007 cm–1 peaks; a 1140 cm–1 shoulder; and a shoulder developing to a peak in the 1076 cm–1 region.
800–700 cm–1: This region shows the Si-O bending vibration bands in SiO4 tetrahedral polymers, as well as the Al-O stretching vibration bands in polyhedral polymers (Zhang et al., 1986). There were four peaks in all 22 samples.
Below 700 cm–1: These are the stretching vibration bands of Al-O (and/or Si-O) and the bending vibration bands of O-Si-O (and/or O-Al-O), producing sharp peaks at 652 and 589 cm–1 and the shoulders between them (Zhang et al., 1986).
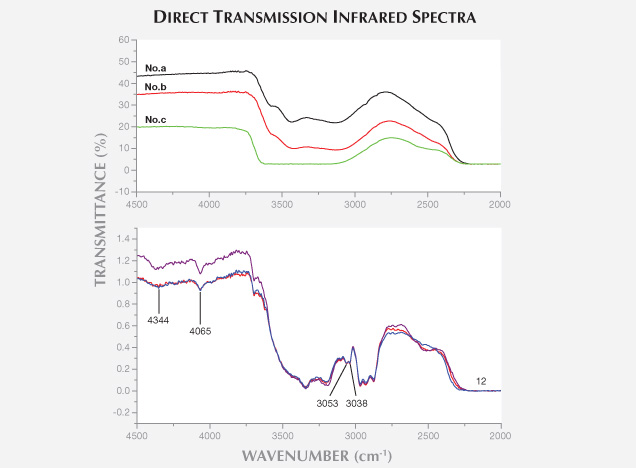
From the above tests, we confirmed that all the beads were filled by a material with the structure of benzene.
There was a clear difference in the 2927–2869 cm–1 range between the strongly and weakly fluorescent samples. The strongly fluorescent moonstone had a strong absorption band, and the weakly fluorescent samples showed weak absorption (figure 8). This suggests that samples with stronger fluorescence contain more filling.
