Vanadium and Chromium-Bearing Pink Pyrope Garnet: Characterization and Quantitative Colorimetric Analysis
ABSTRACT
A type of pink pyrope garnet containing vanadium and chromium, believed to have been mined in Tanzania, appeared at the 2015 Tucson shows. The material shows a noticeable color difference from purplish pink under incandescent light (A) to purple under daylight-equivalent light (D65). This study reports a quantitative analysis of the difference in color between the two lighting conditions, based on the use of high-quality visible absorption spectroscopy to calculate CIELAB 1976 colorimetric coordinates. L*, a*, and b* colorimetric parameters were calculated for a wide range of path lengths as extrapolated from visible absorption spectra of thinner samples. Using this method, the path length of light through the stone that produces the optimal color difference can be calculated. This path length can then be used to determine the optimal depth range to maximize color change for a round brilliant of a specific material. The pink pyrope studied here can be designated as “color-change” garnet according to certain classification schemes proposed by other researchers. In many of these schemes, however, the material fails to exceed the minimum requirements for quantitative color difference and hue angle difference to be described as “color-change.” Nonetheless, there is no simple solution to the problem of applying color coordinates to classify color-change phenomena. Also presented is a method by which spectra can be corrected for reflection loss and accurately extrapolated to stones with various path lengths.
INTRODUCTION
Garnets are a group of isometric nesosilicates with the general chemical formula X3Y2Z3O12. X, Y, and Z represent dodecahedral, octahedral, and tetrahedral sites in the crystal structure, respectively. Natural rock-forming silicate garnets with the Z-site occupied by Si4+ are commonly divided into the pyralspite and ugrandite groups. In pyralspite, Al3+ occupies the Y-site and the X-site may contain Mg2+, Fe2+, or Mn2+; these garnets are dominantly composed of the pyrope (Mg3Al2Si3O12), almandine (Fe2+3Al2Si3O12), and spessartine (Mn3Al2Si3O12) end members. The ugrandite garnets have Ca2+ on the X-site and Cr3+, Al3+, or Fe3+ on the Y-site, giving uvarovite (Ca3Cr2Si3O12), grossular (Ca3Al2Si3O12), or andradite (Ca3Fe23+Si3O12) end members. Stockton and Manson (1985) proposed a classification scheme for separating the pyralspite group into the gemological species of pyrope, almandine, spessartine, pyrope-almandine, pyrope-spessartine, and almandine-spessartine. Previously, two types of color-change garnets have been reported: pyrope with very high Cr3+ (Hysingjord, 1971; Carstens, 1973; Amthauer, 1975) and pyrope-spessartine containing both Cr3+ and V3+ (Crowningshield, 1970; Jobbins et al., 1975; Schmetzer and Ottemann, 1979; Manson and Stockton, 1984; Johnson and Koivula 1998; Krzemnicki et al., 2001; Schmetzer et al., 2009). Cr3+-bearing pyrope, however, has not been observed in sizes large enough for faceting. In the trade, almost all color-change garnets are referred to as pyrope-spessartine.
A noticeable and attractive color change under different lighting conditions (i.e., daylight vs. incandescent light) significantly increases the value of a gem, and the decision of whether to apply the “color-change” descriptor is becoming a more important consideration in the trade. The two major systems established to quantitatively analyze color are CIE 1931 (developed in 1931 by the Commission Internationale de I’Éclairage) and CIELAB 1976 (published by the commission in 1976). They have been used to study color-change behavior of pyrope-spessartine garnets from Madagascar (Krzemnicki et al., 2001; Schmetzer et al., 2009). Both articles emphasized that color difference and hue angle difference under various lighting conditions are the most important factors affecting the strength of a stone’s color change (see “Colorimetric Parameters in CIELAB 1976 Color Circle” below).
An interesting observation made after inspecting several faceted stones is that this pink pyrope garnet appears to show a more noticeable “color change” in larger stones. The phenomenon of color-change under a constant lighting but with varying light path length is known as the Usambara effect (Halvorsen and Jensen, 1997; Halvorsen, 2006). Björn (2002) used colorimetric calculations to quantitatively predict the color change caused by the Usambara effect in tourmaline, alexandrite, and color-change garnet. The underlying cause is the relative difference between two transmission windows in the visible absorption spectrum with changing path length.
As noted by previous studies, the presence of two transmission windows in the visible absorption spectrum is also the fundamental cause of a color change under different lighting conditions. Therefore, we sought to determine how a change in path length influences the color difference and hue angle difference under two lighting conditions and how this relates to the greater difference in color seen in the larger pyropes from this study. Liu et al. (1999b) quantitatively calculated the change of hue angle difference under daylight-equivalent light (D65) and incandescent light (A) in a gem tourmaline with varying thickness from the Umba Valley, Tanzania. Liu et al. (1999b) suggested that this tourmaline should only be considered a color-change stone within a certain range of path lengths. Schmetzer et al. (2013) studied a synthetic alexandrite crystal and analyzed the relationship between the “alexandrite effect” and the Usambara effect in this pleochroic mineral with varying thickness. To shed more light on this phenomenon, we have carried out a detailed quantitative study of the influence of path length on color difference and hue angle difference under both lighting conditions for three different garnets. In doing so, we developed a new method to correct the UV-Vis-NIR spectra for reflection loss so that spectra for stones with a short path length could be accurately extrapolated to longer path lengths.
MATERIALS AND METHODS
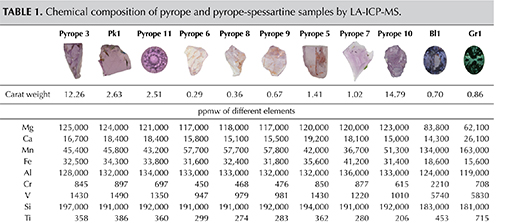
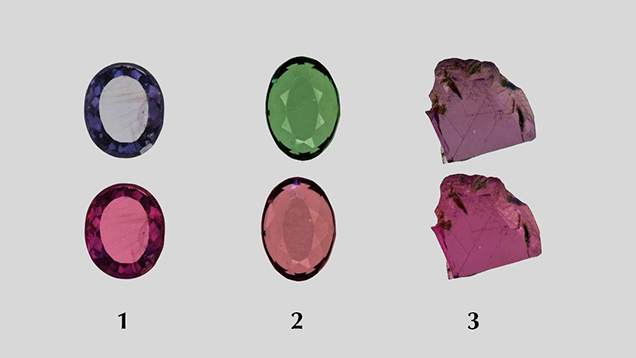
Samples. Twenty-three stones with inclusions provided by Todd Wacks, Jason Doubrava, Jeff Hapeman, and Meg Berry, some of which are shown in figure 1, were used to identify typical inclusions in this material. Among the samples were 21 rough pieces, ranging from 4.04 to 31.90 ct, and two faceted stones weighing 13.88 ct and 13.09 ct. Additionally, eight rough pyrope specimens, ranging from 0.29 to 14.79 ct, and one 2.51 ct faceted pyrope modified round brilliant were provided by Mr. Wacks for chemical analysis. One blue (Bl1) and one green (Gr1) faceted pyrope-spessartine garnet were selected from the authors’ own collection (table 1) for colorimetric analysis, along with one of the rough pink pyrope samples used for chemical analysis (Pk1). A total of 11 stones underwent chemical analysis as part of this study. According to Mr. Wacks, this material may have been mined some 30 years ago in Morogoro, Tanzania (Pay, 2015), and could represent the material documented by Stockton (1988).

Standard Gemological Properties. This study began when GIA’s Carlsbad laboratory received a 2.51 ct transparent purple pink modified round brilliant stone for scientific examination (pyrope 11 in table 1). Standard gemological testing revealed a refractive index (RI) of 1.736 and no birefringence. The specific gravity (SG), obtained hydrostatically, was 3.75. No fluorescence was observed under either long-wave (LW) or short-wave (SW) UV light. Using a handheld spectroscope, weak absorption lines were observed in the blue and violet section—a 505 nm absorption line, and very weak absorption bands at 520 and 573 nm. Microscopic examination showed intersecting long and short needles throughout. All of these properties were consistent with pyrope garnet based on the gemological classification system devised by Stockton and Manson (1985). The stone exhibited a noticeable difference in color between incandescent light and daylight-equivalent light.
Photomicrography. The rough stones were fabricated to wafers with parallel windows using standard lapidary equipment, which oriented the inclusions in the best possible position for photomicrography. Photomicrographs were taken using various Nikon microscopes, including an Eclipse LV100, SMZ1500, and SMZ10 (Renfro, 2015a).
Raman Spectroscopy Analysis. Raman spectra were collected with a Renishaw inVia Raman microscope system. The Raman spectra of the inclusions were excited by a Stellar-REN Modu Ar-ion laser producing highly polarized light at 514 nm and collected at a nominal resolution of 3 cm–1 in the 2000–200 cm–1 range. Each spectrum of the inclusions was accumulated three times at 20× or 50× magnification. In many cases the confocal capabilities of the Raman system allowed inclusions beneath the surface to be analyzed. Several other stones were polished to expose the inclusion to the surface.
LA-ICP-MS Analysis. The chemical composition for each sample, listed in table 1, was obtained with a ThermoFisher X-series II ICP-MS coupled with a New Wave Research UP-213 laser ablation unit with a frequency-quintupled Nd:YAG laser (213 nm wavelength) running at 4 ns pulse width. NIST (National Institute of Standards and Technology) glass standards SRM 610 and 612 and USGS (United States Geological Survey) glass standards BHVO-2G, BIR-1, NKT-1G, and BCR-2 were used for external calibration. Ablation was achieved using a 55 µm diameter laser spot size, a fluence of around 10 J/cm2, and a 15 Hz repetition rate. The garnets were initially internally standardized with 29Si using an educated guess based on the EDXRF analyses. The data was converted to wt.% oxides and normalized to 100 wt.% and then converted back to ppmw. The ppmw concentration of 29Si obtained in this manner was then used for internal standardization to recalculate the chemical compositions. The ppmw values obtained in this final calculation were identical within <1% to those obtained after normalizing to 100 wt.% with the guessed value of 29Si used for internal standardization, demonstrating the validity of this method. We selected six spots on each pyrope sample for general chemical composition. For the three garnet wafers on which we collected UV-Vis spectra (Pk1, Bl1, and Gr1; see table 1 and figures 2 and 13), the LA-ICP-MS analyses were performed in the same region where the spectroscopic data was collected. The EDXRF data agreed with the LA-ICP-MS analyses, generally within 5–10%.

Energy-Dispersive X-Ray Fluorescence (EDXRF) Analysis. In addition to LA-ICP-MS, the composition of three garnet wafers (Bl1, Gr1, and Pk1) was analyzed on an ARL Quant’X EDXRF analyzer from Thermo Electron Corporation. USGS glass NKT-1G was used for external calibration.
UV-Vis-NIR Spectroscopy. Three garnets (samples Bl1, Gr1, and Pk1) were prepared as wafers with parallel polished surfaces and various thicknesses (figure 2). UV-Vis-NIR spectra were collected with a Hitachi U-2910 spectrometer. The spectra were collected in the 190–1100 nm range with a 1 nm spectral resolution at a scan speed of 400 nm/min.
RESULTS AND DISCUSSION
Microscopic Internal Characteristics. The pink pyrope garnets studied here contain a wide range of inclusions in addition to their interesting color properties. An example is the 13.88 ct faceted pyrope in figure 3, which exhibits a black inclusion that can be seen through the table.
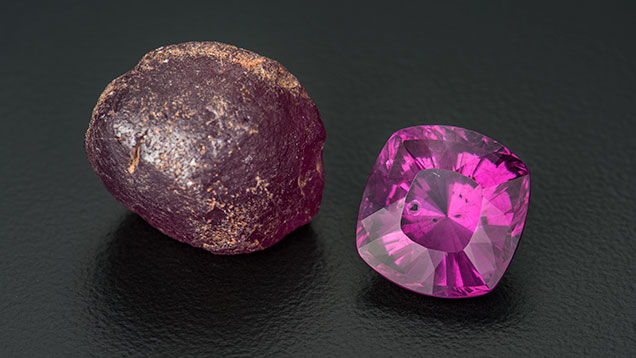
Quartz, apatite, sulfides, graphite, rutile, fingerprint-like inclusions, growth tubes, and negative crystals were observed. Surface features—etch markings and trigons—were also visible. Each type of mineral inclusion was identified by Raman spectroscopy.
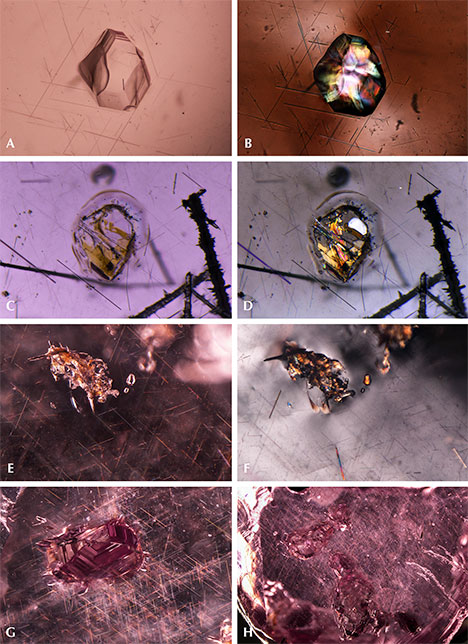
Quartz. Quartz is a common inclusion in the pink pyrope garnets from this study. Pyrope-rich garnet is in general associated with magnesium-bearing basic rocks from the lower crust to the upper mantle. In figure 4A, the morphology of a small colorless transparent quartz crystal with conspicuous surface markings appears to be constrained by step-like growth of the garnet’s (110) faces. This crystal is also surrounded by very fine rutile needles, rendering a pseudohexagonal contour. This syngenetic crystal showed strong birefringent color under polarized lighting (figure 4B). In figure 4C, some yellowish foreign mineral (possibly goethite, dolomite, or a limonitic mineral) and a tiny black prism (possibly hematite, ilmenite, or senaite) were captured by a transparent quartz crystal. Under polarized lighting, the mineral-filled area showed strong birefringent color (figure 4D). No Raman signal could be obtained for this material, but large clusters of quartz crystal with similar yellowish foreign mineral filler were observed in another stone (figure 4E and 4F). In figure 4G, a very large quartz crystal shows a hexagonal crystal habit. Large quartz crystals with irregular shape were also found (figure 4H). Quartz is also a prevalent mineral inclusion in other garnets such as almandine, umbalite (mainly composed of pyrope and spessartine with small amounts of almandine, lacking color change), and color-change pyrope-spessartine garnet (Gübelin and Koivula, 2005).
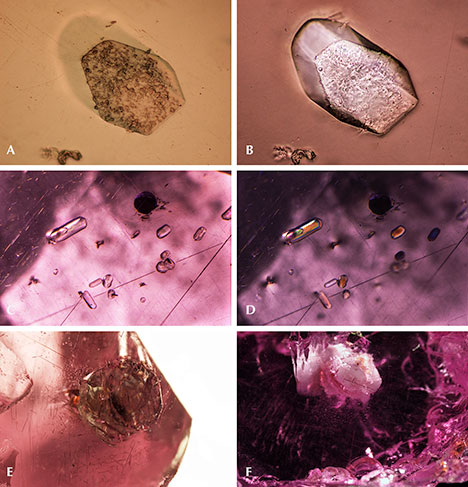
Apatite and Other Phosphate Minerals. Apatite and other phosphate minerals have been found in rhodolite, almandine, spessartine, umbalite, and color-change pyrope-spessartine (Gübelin and Koivula, 2005). To isolate the weak apatite Raman scattering signal from the pink garnet host studied here, a bluish hexagonal prismatic apatite crystal was partially polished through to reach the surface (figure 5A). The outline of the crystal was distinct under polarized lighting (figure 5B). Figures 5C and 5D show a group of rounded apatite crystals whose morphology suggests they were partially corroded before being captured by the garnet. An extremely large euhedral apatite crystal showed a greenish yellow bodycolor (figure 5E) with a fingerprint-like halo extending around its perimeter. Another whitish mineral gave an unidentifiable Raman spectrum, which nonetheless seemed to share many similarities with Raman spectra of other phosphate minerals (figure 5F).
Sulfides. Sulfide crystals are another very common mineral inclusion in these pink pyrope garnets. Raman spectroscopy was inconclusive, even when the inclusions were polished to the surface; the closest match was for chalcocite, although other sulfides and sulfosalts gave reasonable matches as well. Figure 6A shows a rounded sulfide crystal that was partially exposed and showed a metallic luster under reflected light. The depression next to the crystal suggests that there was originally another sulfide crystal. The crystal outline is distinct under darkfield illumination (figure 6B). All the sulfides showed a reddish reflected color when illuminated by a fiber-optic light from the side of the wafer (figure 6C, 6D, and 6E), although this may represent the red color of the light transmitted through the garnet. Some of these inclusions have associated fingerprint-like inclusions showing birefringent color under cross-polarized lighting (figure 6F and 6G), and many are surrounded by clusters of rutile needles (figure 6F). An orange iron oxide mineral is also associated with fractures near some of these sulfide inclusions (figure 6F). The flow lines next to the rutile cluster on the top part of figure 6G may be the result of excess titanium in the mineralization environment, which causes TiO2 to precipitate and coalesce as “silk” as the garnet cools.
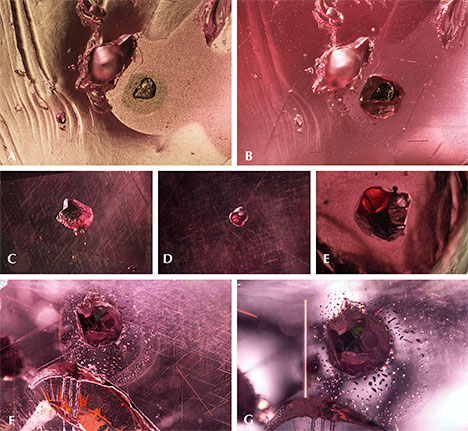
Graphite. Black tablets of graphite represent one of the more frequent inclusions of the pink pyrope garnets in this study. The partially exposed graphite crystal in figure 7A showed a dull luster. The outline of the crystal and a surrounding tension halo became distinct under darkfield illumination (figure 7B). Some of the graphite showed a very uniform layered pseudohexagonal crystal structure (figure 7C). The whitish tension halo is always present around the graphite (figure 7C). The presence of graphite suggests a relatively high-grade metamorphic formation process. It is also a frequent guest mineral in almandine and color-change pyrope-spessartine. The common association of V-bearing gem material with graphite, as found in this pink pyrope in many gem-bearing metamorphic deposits from East Africa (e.g., tanzanite and tsavorite), is of interest.

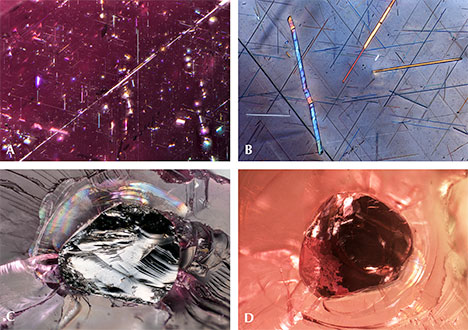
Rutile. Strong fiber-optic lighting revealed a three-dimensional network of (presumably) rutile needles and unknown mineral platelets that showed flashes of iridescent color (figure 8A). The slender needles appeared to outline the edges of a rhombododecahedron (probably aligned along <110>). Under cross-polarized lighting, the needles showed birefringent color (figure 8B). One blocky rutile crystal that presented itself along a fracture surface appeared to have a metallic luster under reflected lighting (figure 8C). Observing this mineral from the opposite side revealed how it would look like as an inclusion in a stone (figure 8D). This blocky rutile crystal appeared black and opaque.
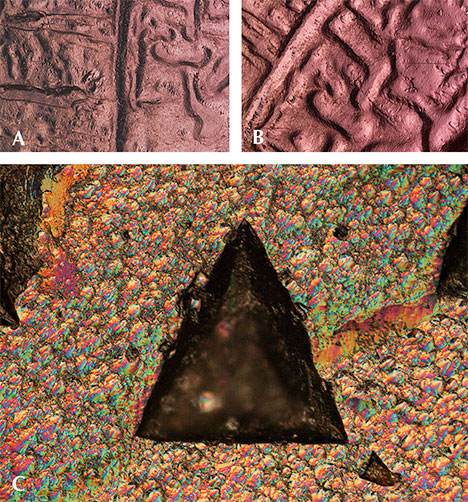
Fingerprint-Like Inclusions. Fingerprint-like fluid inclusions are common features in the pyrope garnets. In figure 9A, a large secondary inclusion plane is partly filled by some foreign material, possibly quartz. Viewed in cross-polarized light, the inclusions appear to show birefringent colors, suggesting the presence of some mineral phase that presumably precipitated from the fluid that originally occupied a partially healed fracture plane (figure 9B). The interference colors in this photomicrograph are all of low intensity, and the image is quite dark. The picture immediately takes on an array of vivid colors with the insertion of the first-order red compensator (figure 9C; see Koivula, 1984; Renfro, 2015a).

Growth Tubes and Negative Crystals. These pink pyrope garnets are also characterized by the presence of many hollow tubes whose sides appear to be confined by the crystal structure. It is possible that rutile or another needle-like mineral inclusion originally occupied these spaces but was later dissolved. Alternatively, these could be growth tubes caused by some defect in the crystal lattice that blocked garnet growth in a specific zone while the bulk of the garnet continued to grow around it, resulting in a hollow tube. Many of the hollow tubes were later filled with epigenetic yellowish limonitic material (figure 10, left). Some tabular rounded negative crystals were also observed (figure 10, right). Those voids do not show an interference color under cross-polarized lighting and are thus probably filled with some fluid or vapor phase.

Surface Features: Etch Markings and Trigons. Unusual slightly rounded and circuitous channels were observed on the surface of one piece of pink garnet rough. To our knowledge, such a pattern has not been described in garnet or any other gem material. One possible explanation is that a larger piece of garnet broke along a large secondary fluid inclusion plane, and the pattern left by the fluid inclusion plane was corroded and rounded, ultimately forming the channels seen in figures 11A and 11B. Other fresh pink pyrope surfaces show trigon-shaped depressions that can be effectively imaged using episcopic differential interference contrast (DIC), as shown in figure 11C (see also Koivula, 2000; Renfro, 2015b). The formation process of those large trigons is still unknown, although such features are presumed to be caused by late-stage dissolution or etching.
The inclusions observed suggest that this pink pyrope garnet is a product of high-grade metamorphic formation processes. Weak to strong corrosion probably also occurred sometime after the crystal growth, likely after peak metamorphic conditions.
Chemical Analysis. Table 1 shows the chemical composition of nine pyrope and two pyrope-spessartine garnets, expressed as ppmw (parts per million by weight), oxide percent by weight (as derived from ppmw values from LA-ICP-MS measurements; other trace elements are not reported here), and mole percent end members (mol.%), calculated using the spreadsheet method of Locock (2008). We conclude that this type of pink pyrope garnet has the following end-member composition: pyrope 68.92–72.90 mol.%, grossular 4.48–5.61 mol.%, spessartine 9.55–15.08 mol.%, almandine 5.66–10.14 mol.%, uvarovite 0.19–0.37 mol.%, and goldmanite 0.49–0.76 mol.%. The composition of two pyrope-spessartine garnets (Bl1 and Gr1) is also listed for comparison in table 1. As a secondary check on the accuracy of the LA-ICP-MS results, the composition of the three garnet wafers (Bl1, Gr1, and Pk1) was also analyzed by EDXRF. The EDXRF results generally agreed with the LA-ICP-MS measurements within 5–10% for the elements listed in table 1.
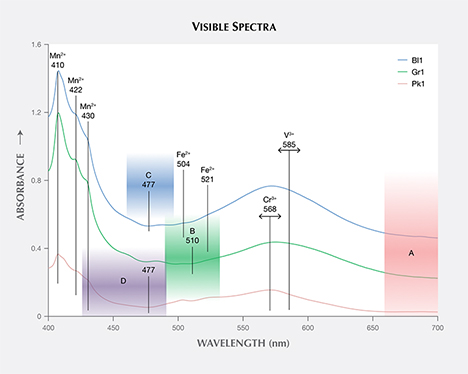
Visible Absorption Spectrum Analysis. Accurate visible spectroscopic measurement relies on correctly identifying the spectral baseline. This is especially true in the present study, where spectra for stones with long path lengths were produced by multiplying the spectrum collected from thin wafers (approximately 1–4 mm) by an appropriate factor. In this case, the baseline must be carefully corrected to avoid amplifying any errors inherent in fitting the baseline.
Absorbance, A, in our UV-Vis-NIR spectra is the sum of Ac (chromophore light loss), Arl (reflection light loss, surface of the gem), and Aisl (inclusion-scattering light loss). An equation can be written simply as
A = Ac + Arl + Aisl (1)
Samples Bl1, Gr1, and Pk1 were polished into wafers with thicknesses of 1.478, 1.416, and 3.500 mm, respectively. After UV-Vis-NIR spectra were collected (red traces in figure 12), the three wafers were further polished down to thicknesses of 0.906, 0.842, and 2.278 mm. UV-Vis-NIR spectra were collected on the thinner wafers (green traces in figure 12). When the short path length traces are subtracted from the long path length traces, the resulting spectra (blue traces in figure 12) have the Arl reflection light loss removed because Arl is expected to be the same regardless of the stone’s thickness. These spectra, corrected for reflection light loss, correspond to path lengths equal to the difference between the long and short path lengths for each stone. Now we can use these reflection-corrected spectra to produce the spectra of any desired path length by multiplying by an appropriate constant. We can also calculate the spectra of the reflection light loss (purple traces in figure 12) by renormalizing the reflection-corrected spectra to the original path lengths and taking the difference between the corrected and uncorrected spectra, as discussed below.
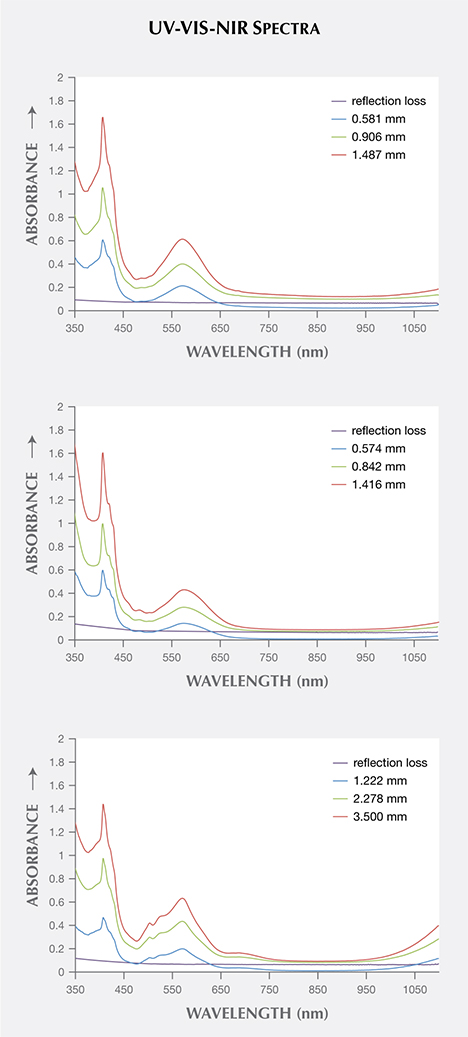
The baselines of the reflection-corrected spectra are not equal to 0 at 850 nm, which would be expected with an absolutely perfect correction. The magnitude of the residual baseline correlates with the relative amount of rutile inclusions observed in the garnets, with Bl1 having the highest concentration and Gr1 the lowest. Thus, we can conclude that the residual baseline is mainly caused by inclusion-scattering absorption (Aisl in equation 1). Note that no attempt is made to correct the spectra for Aisl. If we assume that light scattering particles are evenly distributed and have uniform orientation, size, and shape within a certain stone, then the magnitude of this term is expected to be dependent on the thickness of the stone. While this assumption will not be strictly correct for most gem materials, a more rigorous correction for Aisl is not feasible at the moment, and will probably not have a significant impact on the results.
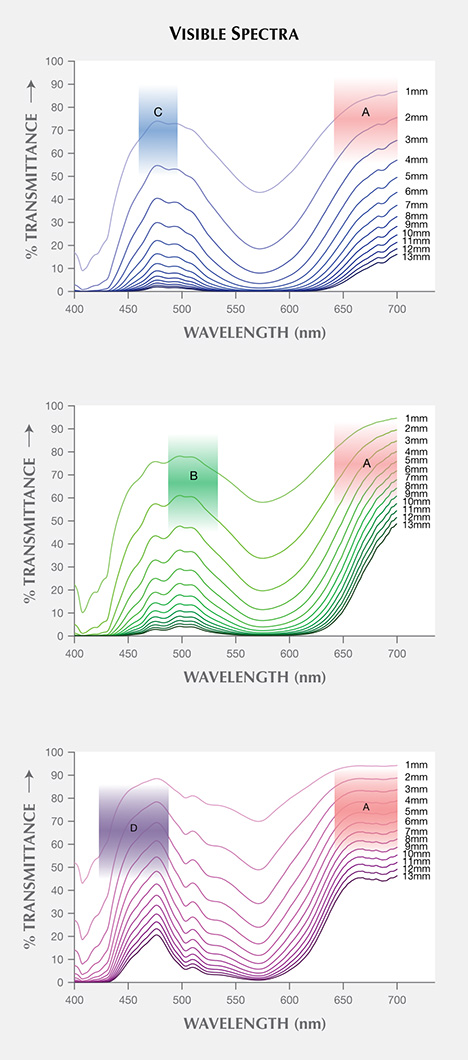
The calculated visible spectra for samples Bl1, Gr1, and Pk1 share many of the same features, as shown in figures 13 and 14. The absorption bands at 410, 422, and 430 nm are caused by Mn2+, while those at 504 and 521 nm are caused by Fe2+ (Moore and White, 1972). A wide absorption band between 550 and 600 nm is caused by contributions from both Cr3+ and V3+ (Geiger et al., 2000). Sample Bl1 shows two transmission windows: Window A lies in the red section from 650 to 700 nm; window C, with its transmission maximum at 477 nm, lies in the blue section of the spectrum (figure 14). Sample Gr1 shows the same transmission window in the red section of the spectrum (window A), but the higher-energy transmission window is more open to wavelengths of light in the green section, with its transmission maximum at 510 nm (window B). The red transmission window for Pk1 is wider than for the other two samples. The higher-energy window has a transmission maximum at 477 nm, similar to Bl1, but with more transmission in the higher-energy (violet) section due to the lower Mn2+ content (again, see figure 14). The transmission windows described here are similar to those mentioned by Schmetzer et al. (2009).
SPECTRUM AND COLORIMETRIC DATA ANALYSIS
Visible Transmission Spectra. The spectra of three garnets were converted to transmission spectra with path lengths from 1 to 13 mm by multiplying the spectra by an appropriate value (l/l0, where “l” is the desired path length and “l0” is the path length of the reflection-corrected spectrum—0.581 mm, 0.574 mm, and 1.222 mm for Bl1, Gr1, and Pk1, respectively). For all samples, the transmission windows became smaller as the path length increased (figure 15). CIELAB 1976 L*, a*, b* color space coordinates were calculated for each spectrum under incandescent and daylight-equivalent light with the GRAMS software using the relative spectral power distribution of CIE standard illuminant D65 and A, and CIE 1931 2° standard observer (CIE, 2004).
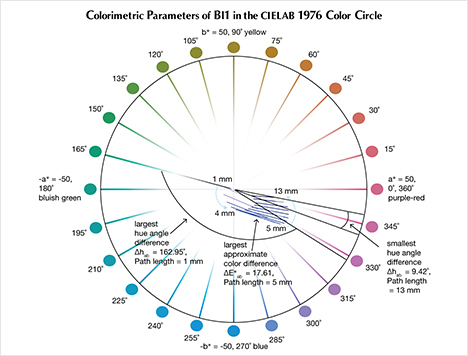
Colorimetric Parameters in CIELAB 1976 Color Circle. Thorough discussions of the principles behind the CIELAB 1976 color circle have appeared elsewhere (CIE, 2004; Schmetzer et al., 2009). Therefore, we present a brief introduction and direct the reader to other sources for more detailed explanations.
The color circle has three axes in a three-dimensional space. L* represents lightness and is perpendicular to the plane of the paper. A low L* value signifies a darker color, a high value a lighter color. The variables a* and b* lie in the plane of the paper and define a two-dimensional Cartesian coordinate system that represents the different colors and color saturations possible within the color circle. The coordinates a* and b* can also be converted to polar coordinates C*ab and hab.
The variable C*ab represents chroma or saturation, and a higher C*ab value means a more saturated color. It is calculated by the equation

The hue angle, hab, is calculated by the equation
hab = arctan(a*/b*)
Variations in hab cause changes in hue, starting from purple-red at 0°, yellow at 90°, bluish green at 180°, and blue at 270°.
Finally, E*ab signifies the geometric distance of a specific L*a*b* color coordinate in three-dimensional CIELAB color space from the origin at L* = 0, a*= 0, and b*= 0. E*ab is calculated by the equation

The utility of E*ab lies in the fact that the difference in this value for two different color coordinates, ΔE*ab, is a reliable measurement of the absolute color difference between, for instance, the color of a stone under two different lighting conditions.
The color difference between daylight-equivalent (D65) and incandescent (A) lighting, ΔE*ab, is calculated by the equation

where Δa*= a* D65 – a*A, Δb*= b* D65 – b*A, and ΔL* = L* D65 – L*A.
Δhab(°), the hue angle difference between daylight-equivalent (D65) and incandescent (A) lighting, is calculated by the equation
Δhab = | hab, D65 – hab,A |
ΔC*ab, the chroma (saturation) difference between daylight-equivalent and incandescent lighting, is calculated by the equation
>ΔC*ab = | C*ab, D65 – C*ab,A |
Table 2 shows values of C*ab, hab, ΔC*ab, Δhab, and ΔE*ab of three garnet samples (Pk1, Bl1, and Gr1) under daylight-equivalent and incandescent lighting with path lengths from 1 to 13 mm.

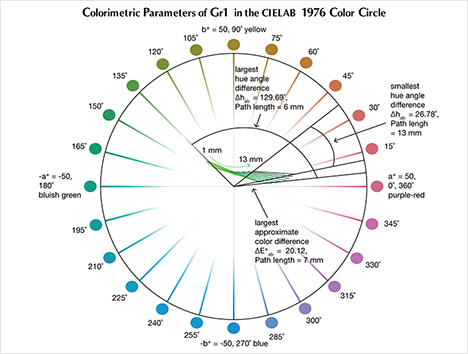
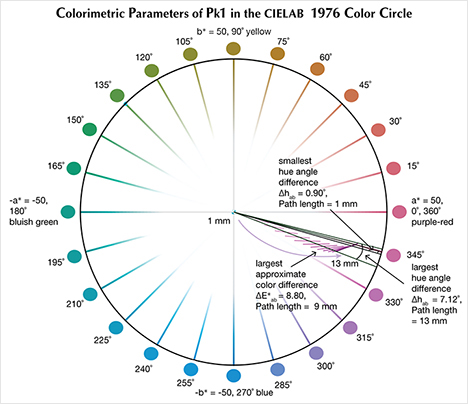
The CIELAB 1976 Color Circle Plots (Schmetzer et al., 2009 and 2013). A convenient way to represent the color difference between daylight-equivalent (D65) and incandescent (A) lighting for a sample is to project the three-dimensional L*a*b* coordinates into the two-dimensional a*b* plane (the color circle) and draw a tie-line between the D65 and A lighting coordinates. Furthermore, if one wants to track the color difference between D65 and A lighting with increasing light path length, such tie lines could be drawn for each path length and plotted on the same color circle. We did so for garnet samples Bl1, Gr1, and Pk1, with path lengths from 1 to 13 mm (figures 16–18). The right ends of the tie lines represent the color coordinates under incandescent lighting (A). The left ends of the tie lines represent the color coordinates under daylight-equivalent lighting (D65).
Alternatively, one could isolate a specific variable such as ΔE*ab, Δhab, or ΔC*ab and plot its changes with the light path length. Such plots are shown for samples Pk1, Bl1, and Gr1 in figure 19. All three show similar behavior in their color difference vs. path length plots, with ΔE*ab steadily rising with path length until reaching a critical point and falling again (figure 19, left column). However, these three stones all showed different behavior in hue angle difference vs. path length plots and chroma difference vs. path length plots (figure 19, center and right columns). The hue angle difference Δhab of sample Bl1 decreases steadily as the stone becomes thicker. The hue angle difference Δhab of Gr1 increases until reaching its highest value when the path length is 6 mm, after which it begins to decrease. On the other hand, the hue angle difference Δhab of Pk1 simply continues to rise with the thickness of the stone until reaching a 13 mm path length (figure 19, middle column). The chroma difference ΔC*ab of Bl1 and Pk1 increases until reaching their maximum values, after which they decrease again (figure 19, right column, top and bottom rows). The chroma difference ΔC*ab of Gr1 increases first, then decreases before rising again to form a wave shape (figure 19, right column, middle row). At greater path length, the magnitude of the color change increases at first as the chroma (saturation), chroma difference, or hue angle difference increases and then decreases as the chroma, chroma difference, or hue angle difference decreases. This occurs because one of the transmission windows is preferentially “closed” as the stone becomes thicker. This type of behavior is related to the strength of two transmission windows (figure 14) and the complex relationship between them. It is difficult to predict without an accurate quantitative calculation, and this behavior is expected to vary between different gem materials.
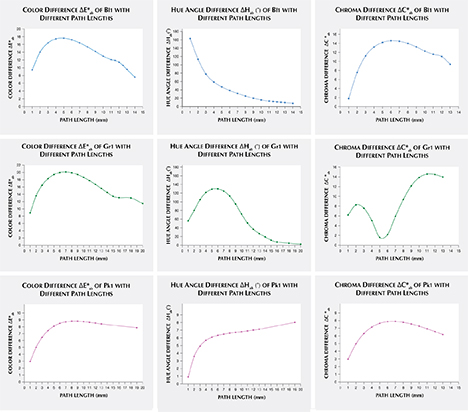
An interesting phenomenon was observed in the color difference vs. path length plots of Bl1 and Gr1. When the stone becomes darker with increasing path length, a small bump forms instead of a smooth curved line (figure 19, left column). Presently, we cannot offer an explanation for this unusual behavior.
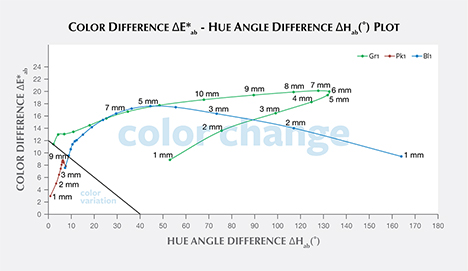
Color Difference ΔE*ab vs. Hue Angle Difference Δhab Plots, and the Problem of “Color Change.” Color difference vs. hue angle difference plots reveal that Bl1 and Gr1 show a larger color difference ΔE*ab and hue angle difference Δhab than Pk1 at nearly all path lengths (figure 20).
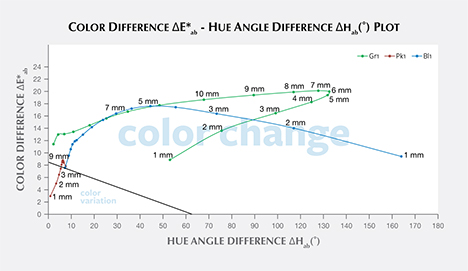
Liu et al. (1994, 1999a) suggested that a stone should have a hue angle difference Δhab larger than 20˚ and a chroma difference ΔC*ab higher than 5 to be considered a color-change stone. Schmetzer et al. (2009) proposed three different sets of criteria that could be used to decide whether to describe a stone as having a “color change.” The first set of criteria suggests that a stone should have a hue angle difference Δhab larger than 60˚ or a color difference ΔE*ab larger than 9. The second and third set of criteria are shown graphically in figures 20 and 21, respectively, and offer a distinction between “color change” and “color variation” depending on where the stone plots in a specific region of the ΔE*ab vs. Δhab space.
To facilitate discussion of color change and its relationship to path length in these three stones, the color of Bl1, Gr1, and Pk1 under daylight-equivalent light and incandescent light was quantitatively reproduced for path lengths from 1 mm to 13 mm by converting CIE L*, a*, and b* color space coordinates into color swatches using Adobe Photoshop (figure 22).
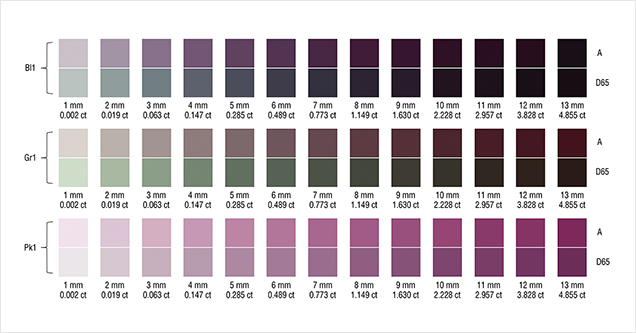
According to the classification of Liu et al. (1994, 1999a), Bl1 can be considered to have a color change when the path length of light passing through the stone is between 3 and 9 mm. Likewise, Gr1 is a color-change garnet when the path length is between 2 and 13 mm. Because Pk1’s hue angle difference Δhab is never larger than 20˚, it cannot be considered a color-change stone according to this classification.
According to the first classification of Schmetzer et al. (2009) described above, Bl1 is a color-change stone when path length is between 1 and 13 mm, Gr1 is a color-change stone when path length is between 2 and 13 mm, and Pk1 is never a color-change garnet because its ΔE*ab is never larger than 9 and its Δhab is never larger than 60°. According to the second classification scheme of Schmetzer et al. (2009), Bl1 is a color-change stone when path length is between 1 and 13 mm, as are Gr1 when path length is between 1 and 13 mm and Pk1 when path length is between 4 and 13 mm (again, see figure 20). According to the third classification scheme of Schmetzer et al. (2009), Bl1 is a color-change stone at path lengths between 1 and 13 mm, as is Gr1 at path lengths between 1 and 13 mm, and Pk1 is never a color-change garnet (figure 21).
Considering the ΔE*ab vs. Δhab plots used by Schmetzer et al. (2009) as criteria, it makes sense intuitively that stones with low ΔE*ab and Δhab values do not possess a color change. Likewise, stones with high ΔE*ab but very low Δhab should probably not be described as “color-change”—even though the saturation and/or lightness may change between daylight-equivalent and incandescent lighting, there will be no significant change in hue, which is likely the most important factor. Nor do samples with large Δhab but very small ΔE*ab values qualify as color-change stones, because their saturation is too low for color differences to be readily observed. It should be pointed out that there is no unique solution to the problem of classifying color-change stones based on their CIELAB color coordinates, as the entire concept of “color change” is inherently subjective. A more objective boundary for color-change stones might be achieved through a comprehensive survey of gemologists, jewelers, collectors, and gem enthusiasts. But even the most comprehensive survey cannot be expected to provide an absolute classification scheme for color-change gems.
THE RELATIONSHIP BETWEEN CARAT WEIGHT AND ACTUAL PATH LENGTH IN A STANDARD
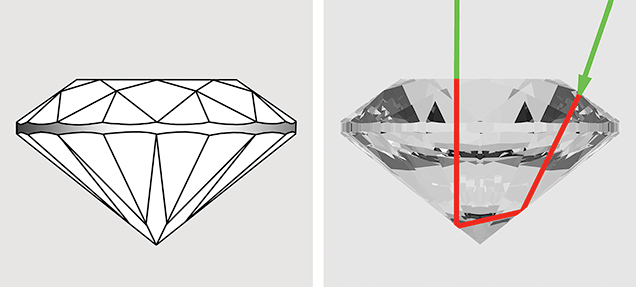
Round Brilliant. To relate the path lengths used in our color calculations above to the size of faceted stones, we report here the results of calculations, using DiamCalc software, that show the relationship between carat weight and actual path length for a 57-facet round brilliant garnet. The stone has an RI of 1.750 and an SG of 3.875; its proportions are listed in table 3. The path length represents a ray of light entering the garnet at approximately 70° to the plane of the girdle (from over the shoulder of the observer). The light passes through the middle of a bezel facet, strikes the middle of a pavilion main facet, and is reflected to the opposing pavilion main facet before exiting through the table to the eye of the observer directly overhead (red line in figure 23). The carat weight of each path length from 1 to 13 mm was calculated and is reported in figure 22. This calculation is only for round brilliants of the specific proportions presented in table 3. The path length will vary with the way the stone is cut. The concentration, distribution, and orientation of the inclusions will influence how the light passes through and is absorbed into the stone. This factor has not been corrected for individual stones in this study.
| TABLE 3. Proportions of the round brilliant cut garnet used to demonstrate the relationship between carat weight and path length. | |
| Crown angle (°) | 35.00 |
| Pavilion angle (°) | 38.50 |
| Total height (%) | 59.35 |
| Crown height (%) | 15.06 |
| Pavilion height (%) | 39.79 |
| Table (%) | 57.02 |
| Girdle height bezel (%) | 4.50 |
| Star angle (°) | 20.75 |
| Upper girdle angle (°) | 41.10 |
| Lower girdle angle (°) | 39.56 |
CONCLUSIONS
What sets this type of pink pyrope garnet apart from other color-change pyrope-spessartine garnets is the somewhat lower concentration of vanadium and chromium and also the much higher pyrope component (Mg3Al2Si3O12). From the colorimetric analysis of three different samples, we have the following thoughts.
The Usambara effect and color change are two manifestations of the phenomenon of having two distinct transmission windows in the visible spectrum. This study quantitatively described the interplay between color change and the Usambara effect (Schmetzer et al., 2013).
To make this comparison between the Usambara effect and color change, a reflection loss correction method was developed. This method allowed us to accurately manipulate the UV-Vis spectra to calculate color under different lighting conditions for various path lengths.
As path length increases, the difference in color between incandescent and daylight-equivalent lighting increases at first as chroma (saturation), chroma difference, or hue angle difference increases. The color difference then decreases as chroma, chroma difference, or hue angle difference decreases. This latter effect occurs because one of the transmission windows is preferentially “closed” in the thicker portions of the stone.
By this reasoning, there is one path length that should show the greatest difference in color between incandescent and daylight-equivalent lighting, another with the greatest hue angle variation, and still another with the greatest saturation variation. While this path length may not be the same in all cases, there should be a range of path lengths that show the best color change. Below or above this range, the saturation is too low or the hue angle change or saturation change is too slight to produce an observable color change.


