Notes & Techniques Gems & Gemology, Fall 2015, Vol. 51, No. 3

Origin Determination of Dolomite-Related White Nephrite through IB-LDA


Chinese nephrite pendant and two carvings
Figure 1. A: An ancient pendant discovered in the tomb of Marquis Yi, ruler of Zeng State during the Warring States period (ca. 475–221 BC). © Hubei Provincial Museum. B: The imperial seal made with white nephrite for Emperor Yong­zheng during the Qing dynasty (1723–1735 AD). © Sotheby’s. C: “Autumn Moon Over Han Palace” (left) and “Spring Morning Over Han Palace” (right) placed second in the Gems & Jewelry Trade Association of China’s 2012 Tiangong Award for excellence in jade carving. © The Boguan Auction Company.

ABSTRACT

Provenance studies on nephrite jade are of gemological as well as archeological importance. Origin determination is difficult to achieve relying solely on typical gemological properties and observations. In this study, the authors present a new statistical analysis method, based on linear discriminant analysis (LDA) and trace-element data from laser ablation–inductively coupled plasma–mass spectrometry (LA-ICP-MS), to achieve significantly improved origin determination (an average of 94.4% accuracy) for eight major dolomite-related nephrite deposits in eastern Asia. As the principle is to compare one location to the rest in one round and continue such binary comparison until all possible localities are tested, the method is referred to as iterative-binary LDA (IB-LDA). Combined with trace-element composition data from LA-ICP-MS, it could prove to be a useful technique for the geographic origin determination of other gemstones.

INTRODUCTION

Nephrite jade has been of great interest to East Asian cultures dating back to the Neolithic Age (Wen and Jing, 1996; Tsien et al., 1996; Wen, 2001; Harlow and Sorensen, 2005). Historically, it has been considered a symbol of wealth and power for Chinese emperors and nobility (figures 1A and 1B). Nephrite from countries such as China, Russia, and South Korea (Ling et al., 2013) continues to attract considerable attention as a gem and ornamental material, particularly in the Chinese market. Thus, geographic origin determination is important in terms of proper classification, valuation, and archaeological implications.

In Chinese culture, white is usually regarded as the color of purity and perfection (He, 2009). Due to its quality and well-established historical reputation, white nephrite from Xinjiang has maintained the highest price in the Chinese market. Xinjiang nephrite is usually translucent, with colors ranging from white and greenish white to yellow. The best material from this province is white nephrite with greasy luster, known in the trade as “mutton fat” jade. The purity, fine texture, and luster of white nephrite from Xinjiang come together to create an ele­gant cultural symbol (figure 1C).

White nephrite from other deposits, including Baikal (Russia), Chuncheon (South Korea), and Qinghai (China), has similar characteristics and is difficult to distinguish with the unaided eye or even microscopic observation (Wu et al., 2002; Ling et al., 2013). In some cases, material from other locations has been falsely represented as Xinjiang nephrite jade to fetch higher prices. A reliable quantitative method for geographic origin determination is urgently needed to protect nephrite consumers.

Nephrite is a gem-quality tremolite or actinolite polycrystalline aggregate. It is usually classified as either dolomite-related or serpentine-associated, which have different formation processes and different concentrations of Fe, Cr, Co, and Ni, as well as oxygen and deuterium isotopes (Yui and Kwon, 2002; Harlow and Sorensen, 2005; Siqin et al., 2012; Adamo and Bocchio, 2013). Dolomite-related nephrite is usually white, greenish white, yellow, or light gray, due to the relatively low concentrations of the transition metal elements listed above. Serpentine-associated nephrite is usually green. A typical example is Siberian green nephrite from Russia, known for its purity of color. The geographic sources of serpentine-associated nephrite, such as New Zealand, mainland China, and Taiwan, can be distinguished by some characteristic elements in chromite inclusions and by strontium isotopes (Adams et al., 2007; Zhang and Gan, 2011; Zhang et al., 2012).

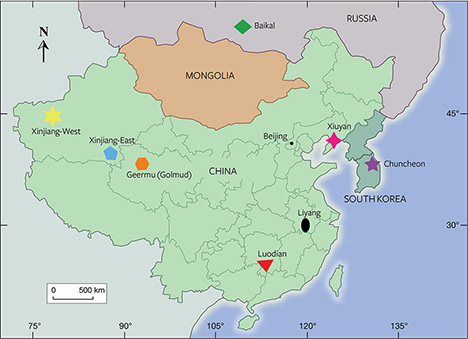
There is no widely accepted method for distinguishing the geographic origin of dolomite-related nephrite. Two factors account for this. First, there are many sources for dolomite-related nephrite in East Asia. Eight major locations are listed in figure 2: western Xinjiang (including the famous Hetian area) and eastern Xinjiang province (China); Geermu, also known as Golmud (Qinghai province, China); Xiuyan (Liaoning province, China); Luodian (Guizhou province, China); Liyang (Jiangsu province, China); Baikal (Russia); and Chuncheon (South Korea). Second, because of their similar standard gemological properties, such as color, transparency, luster, refractive index, specific gravity, and major element components (Liao and Zhu, 2005; Ling et al., 2013; Liu and Cui, 2002), dolomite-related nephrite jades from these locations are very difficult to distinguish.
Map of East Asian nephrite deposits
Figure 2. The eight major dolomite-related nephrite deposits in East Asia reviewed in this study. Xinjiang province has been divided into east and west regions because of their different ore-forming conditions (Tang et al., 1994). Modified from Ling et al. (2013).

Geochemical research has shown that trace elements can reflect the sources of gemstones (Breeding and Shen, 2010; Blodgett and Shen, 2011; Shen et al., 2011; Zhong et al., 2013). But as the number of producing localities and the complexity of chemical composition increase, simply evaluating one or two elements cannot distinguish the different origins (Siqin et al., 2012). Multiple elements, and correlations between those elements, must be taken into account. Identifying and optimizing the variables that characterize differences among origins becomes the main focus.

Linear discriminant analysis (LDA) is a popular statistical method that can reduce the multiple dimensions of variables and provide reliable classification accuracy (Fisher, 1936; Yu and Yang, 2001; McLachlan, 2004; Guo et al., 2007). Recently, this method has been used to identify the geographic origins of some single-crystal gemstones such as Paraíba tourmaline, ruby, sapphire, and peridot (Blodgett and Shen, 2011; Shen et al., 2013).

In this work, the trace-element composition and distribution of 138 dolomite-related nephrite samples from the major producing areas in East Asia have been carefully summarized. Based on the trace-element data, we propose an algorithm, which we refer to as iterative binary LDA (IB-LDA), to achieve nearly complete separation of the dolomite-related nephrite deposits. This method may have wide-ranging applications for additional mineral and gemstone origin research in the future.

MATERIAL AND METHODS

Sample Preparation. All samples in this study were collected directly from the mines in eight major East Asian dolomite-related nephrite jade deposits. A total of 138 samples, with 15–19 specimens from each locality (see table 1), were chosen for LA-ICP-MS testing.

TABLE 1. Dolomite-related nephrite samples used in this study.
Labeled Locations Mining area sources
Quantity
(total 138)
LA-ICP-MS
test points
(total 452)
Main color
1 Xinjiang-West West of Xinjiang province,
China; includes Hetian,
Yecheng, Xueyanuote,
Xinzang 383, and Datong
17 60
White to greenish
white
2 Xinjiang-East East of Xinjiang province,
China; includes Qiemo and
Ruoqiang
18 60 White to light
greenish white
3
Geermu
(Golmud)
Qinghai province, China 17 60 White to light
greenish white
4 Baikal Russia 17 60 White
5 Chuncheon South Korea 21 60 White
6 Xiuyan Liaoning province, China 17 60 White to caramel
7 Luodian Guizhou province, China 15 60 White
8 Liyang Jiangsu province, China 16 32 Greenish white

The samples were cut into blocks measuring 3.0 × 1.5 × 0.5 cm (length × width × height). The bodycolor ranged from white to light greenish, with scattered colors such as yellow in some samples. Samples with representative color from each deposit are shown in figure 3.

Eight nephrite block samples
Figure 3. Representative 3.0 × 1.5 cm nephrite samples from the eight dolomite-related deposits in this study: (A) Xinjiang-West, (B) Xinjiang-East, (C) Geermu (Golmud), (D) Baikal, (E) Chuncheon, (F) Xiuyan, (G) Luodian, and (H) Liyang. Photos by Zemin Luo.

On each nephrite block, three to five points along a straight line with 5 mm intervals between each point were selected for LA-ICP-MS testing; see the “LA-ICP-MS Measurement” section below. We collected 60 test points for each origin for further statistical analysis, to be discussed in the “LDA Method” section. Due to the heterogeneous chemical composition of polycrystalline nephrite and the relatively limited number of block samples (only 15–19 per each origin), we treated each test point as an independent sample, so that each origin has a data set of 60 analyses.

LA-ICP-MS Measurement. Trace-element concentrations of the 138 samples were measured using an LA-ICP-MS system at the State Key Laboratory of Geological Processes and Mineral Resources, China University of Geosciences, Wuhan. The LA-ICP-MS system consisted of a GeoLas 193 nm laser and an Agilent 7500 ICP-MS. The laser fluence was set as 10 J/cm2, and the ablation spot size was 32 µm. The widely used quantitative calibration standards of NIST synthetic glasses SRM610 (Pearce et al., 1997) and U.S. Geological Survey (USGS) synthetic glasses of BCR-2G, BHVO-2G, and BIR-1G (Jochum et al., 2005) were used as reference materials. Three to five spots on each sample, at approximately 5 mm intervals along a straight line, were collected for analysis. 29Si was used as an internal standard. Detailed operating conditions for the laser ablation system and the ICP-MS instrument and data reduction were the same as those described by Liu et al. (2008, 2010).

LDA Method. Linear discriminant analysis is the primary tool in this classification of nephrite from dolomite-related deposits. This method was designed for group classification, which aims to maximize between-class variance while minimizing within-class variance. Free software utilizing the statistical programming language R, version 3.1.2, was applied to this statistical analysis. Based on the trace-element concentrations collected using LA-ICP-MS, the general procedure for LDA origin determination entailed two steps. First, original data sets of 40 independent test points for each origin except Liyang (which has a distinguishable feature, to be explored in the Discussion section), along with their trace-element information, were treated as “training sets” to build the discriminant functions (DFs) and find the best separation. The validity of the separation is characterized by the eigenvalue (EV) and total cross validation (CV); see box A for detailed definitions of EV and CV. Second, four additional samples from each origin, along with their trace-element information, were treated as test sets. The purpose of a test set is to estimate how the classification model will deal with the data that was not included in the “training set” to build the DFs. As conventional settings for machine learning models (Kohavi, 1995), two-thirds of the total data sets (280 data points) were used as a training set, and one-third (the other 140 data points) were used as test set. This setting applies throughout the paper unless other specific modifications are mentioned. Detailed descriptions of training sets and test sets also appear in box A.

BOX A: LINEAR-DISCRIMINANT ANALYSIS
What Are DFs, EV, and CV?
In traditional LDA, each locality is classified as a group, and every trace element represents an independent variable. The combination of all these variables forms a “property space,” with each variable an independent dimension. In such property space, statistical analysis assigns weight to each variable based on relative importance. The LDA designs a projection direction composed of weighted variables to achieve the best separation between groups. Along this direction, the scattered points from the same group are minimized within the group and maximized between all groups simultaneously, which can be formulated as an eigenvalue (EV), a term that will be introduced below. Such projection vectors actually are the linear discriminant functions (DFs) defined by LDA. The common mathematical expression of DF is the following:

DF Yk = a1kX1 + a2kX2 + a3kX3 ... + amkXm + bk        (1)

Here Yk is the linear discriminant function score or value for a specific group K (K=1, 2,…N, where N is the number of total groups). X1, X2, X3, … Xm are characteristic variables, corresponding to the selected trace elements in our study; a1k, a2k, a3k, … amk are the discriminant coefficients or weights of each characteristic variable for group K; bk is the constant of linear discriminant function for group K.

EV is the key parameter for building DFs. It can be understood as the ratio of total intergroup deviations to the total intragroup deviations; the concept is defined rigorously by using covariance matrices (see Welling, 2005). In general, the DFs resulting in higher EV are chosen to build the classification model, since they can provide better separation between groups (Buyukozturk and Cokluk-Bokeoglu, 2008).

The classification accuracy and reliability of LDA can be characterized by the cross-validation (CV) accuracy rate (see Kohavi, 1995; Cawley and Talbot, 2003). The most basic mechanism for CV is:
 
  1. Constructing a LDA model using all data points except one.
  2. Using this LDA model to test the omitted data point.
  3. Repeating these steps until every data point is tested.
  4. The percentage of accurately classified omitted data points is the CV value. A higher CV value indicates better validity of the classification model.
Note that EV is the parameter characterizing the validity of DF in the model when building DF on training sets. On the other hand, CV is the parameter evaluating the validity of the model after it is established. These two parameters have different functions and cannot substitute for each other.

Implementing IB-LDA
To improve the CV accuracy rate, we designed the IB-LDA method, which simplifies multiple-group comparisons into pair comparisons. In each round, the LDA process becomes a binary classification: Only the separation between one “chosen” group and the other “unchosen” groups pool is maximized by the discriminant functions. Meanwhile, the within-class variances of the chosen group and the unchosen pool are minimized respectively.

In the first round of IB-LDA, we randomly selected one of the seven localities as the “chosen” group, and the remaining six as the “unchosen” group. LDA was carried out using the statistical package for this two-group comparison. The software automatically selected various numbers of the trace elements among all input trace elements, so that the CV value corresponding to each origin in the chosen/unchosen binary classification can be achieved. Each origin is chosen to compare with the unchosen group, and the origin with the highest CV accuracy rate (versus the remaining six) is determined as the “optimal-chosen group” in this round. Hereafter, the selected trace elements and weights for the “optimal-chosen group” and “unseparated, unchosen group” will be used to build the pair of DFs for the first round of IB-LDA. The DF for the optimal-chosen group acts as the chosen sieve in this round, corresponding to the specific block box and hole in figure 4.

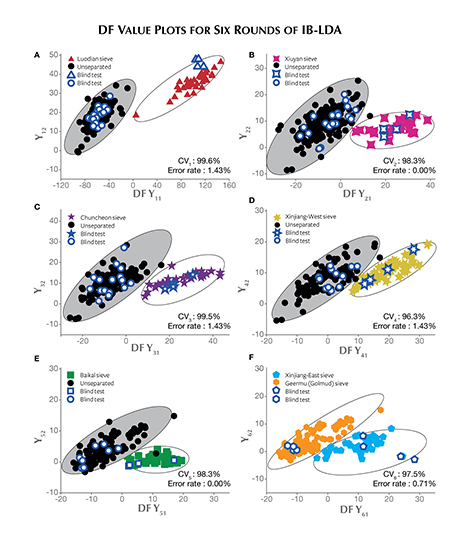
This process is applied to the remaining six localities, with a new set of trace elements chosen by the R software to maximize the EV and CV values. These newly selected trace elements with new weights will build a new pair of DFs for the second round of IB-LDA. Our study using this iterative-binary process identified seven origins sequentially in six rounds in the following order: Luodian, Xiuyan, Chuncheon, Xinjiang-West, Baikal, Xinjiang-East, and Geermu (Golmud). This process is shown in figure A-1.

Statistical analysis method to identify nephrite source
Figure A-1. This plot illustrates how six rounds of IB-LDA were used to separate seven different dolomite-related nephrite sources. The horizontal and vertical axes, named DF Yi1 and Yi2, were the two discriminant functions in the i round (i=1–6). The gray shaded area was the unseparated group. Luodian, Xiuyan, Chuncheon, Xinjiang-West, Baikal, Xinjiang-East, and Geermu (Golmud) were determined as the successive chosen sieves. The CV value in the bottom right of each figure corresponds to the CVi accuracy rate in each round of IB-LDA analysis. The error rate represents the probability of misclassifying the test set obtained in the blind test in each step of IB-LDA. The sum of the six error rates equals 1-AR. Solid and hollow symbols represent the training set and test set, respectively.
Six pair of DFs were obtained for this classification process. The last pair of DFs separating Xinjiang-East and Geermu (training set size of 40 samples for each) was expressed as:

DF Y61(Xinjiang-East) = –2.058Li + 1.554Be + 0.005Al + 0.012K – 9.807Nb – 0.461Ba + 6.452La – 11.891        (2)
DF Y62(Geermu/Golmud) = 0.452Li – 0.682Be + 0.001Al + 4.062Nb + 0.431Ba + 0.145La – 2.376                      (3)

Herein, we defined CVorNi as the CV for the origin N in the IB-LDA. It is defined as the continued multiplication of CVi from the first round to the round in which the particular origin N is classified; see equation (4). CVi is the CV accuracy rate, while i is the number of iterative rounds of IB-LDA:

CVorNi(i=1,2,…N) = CV1 × CV2 × … × CVi–1 × CVi         (4)

The overall CV (CVtotal) for this iterative-binary classification model should be defined as the arithmetic mean value of the CVorNi value of each origin, as calculated in equation (5).

FA15 Dolomite-Related White Nephrite Equation 200x95

Evaluating the Model Validity Based on EV, CV, and AR
As a conventional method for the machine-learning model, we used two-thirds of the total data set as training sets with the remaining one-third as a test set (Kohavi, 1995). We list the EV and CV values for the training set, and the AR values for the test sets, to evaluate the validity and accuracy of the IB-LDA model. EV, CV, and AR values for traditional LDA are also presented for comparison with the IB-LDA model. In terms of both training sets (EV and CV) and test sets (AR), IB-LDA shows greater validity and accuracy than traditional LDA.

The calculated results of IB-LDA CVorNi for the training sets are shown in figure A-2. The overall CV (CVtotal) for IB-LDA (94.4 %) was higher than that of traditional LDA (91.4%). Samples outside the “expected” groups (in this case, the eight nephrite localities) in the training sets will be classified into one of the “expected” groups incorrectly according to its DF score. In machine learning and LDA, the groups “expected” in the model must all be included in the training sets to build the most comprehensive training set and DF. The solution for dealing with “unexpected” wild samples is to collect enough samples to define them as a new group within the training set. This is why all machine-learning models require larger data sets to improve their validity. We include the discussion about the “unexpected” samples in the last paragraph of box A.

Accuracy rates in determining nephrite origin
Figure A-2. The CVorNi for the identified origins in our IB-LDA, and CV for traditional LDA. The detailed algorithm of CVorNi is shown in equation 4. IB-LDA identified geographic origins with a higher CV (an average of 94.4%) than that of traditional LDA (91.4%).
TABLE A-1. EV, CV, and AR values for IB-LDA and traditional LDA
  EV CV total (%) AR (%)
IB-LDA 6.4 94.4 95.0(±2.0)
Traditional LDA 4.4 91.4 85.7(±2.5)
*Note: 40 test points from each origin were used as training sets; the remaining 20 test points from each origin were chosen as test sets. The value in parentheses is the standard deviation of AR after five rounds of blind testing.
CV and EV Values Depending on the Statistical Property of Data Sets. Our analysis was based on 60 data points in each group. To evaluate how the size of the training set can impact the validity (EV) and accuracy (CV) of the model, we conducted a series of tests by randomly removing 10 data points from each group until each training set reached 20 data points. We found that CV generally increased as each training set grew from 20 to 50. Such an increase indicates that the variance can be predicted more precisely with a larger set of samples. The variation of CV and EV with size of the training set is mainly caused by some “irregular” samples, which disturbs the variance in/between groups. We speculate that both EV and CV eventually converge to a constant value, which can only be justified with a larger total data set.

The most practical classification model needs to take into account training set size, CV, EV, and other factors, which is still a real challenge. AR values for blind testing are not included in table A-2. Because the training set is larger than 40 samples for each group, the remaining data set is too sparse to supply a test set with viable statistics. As a major difference between CV and AR in practice, CV is extracted within the training set in the building process of the classification model while AR is obtained beyond the training set after the classification model build. The AR method usually requires a larger original data set to maintain good statistics for both training sets and test sets; this requires further accumulation in the future.
 
TABLE A-2. CV and EV values for different training set sizes.
  Training set size 20 30 40 50 60
IB-LDA EV (mean)
CV total (%)
6.9
93.2
5.9
93.6
6.4
94.4
6.5
95.8
6.4
94.2
Traditional LDA EV (mean)
CV total (%)
5.1
90.0
4.5
88.6
4.4
91.4
4.5
94.0
4.5
93.3
We wish to emphasize that we are speculating on the accuracy and validity of both CV and AR. As the classification model deals with real “unincluded” samples without any knowledge of their origin, CV and AR can only estimate the accuracy or validity of the final analysis result. In the worst-case scenario, a nephrite sample that does not belong to any of the eight origins, it will still be (incorrectly) classified as having one of the above origins, according to its DF score. In this case, the CV and AR are meaningless for such unexpected samples. As with all machine-learning models, LDA requires that all input (the samples’ trace-element information) be correctly paired with the expected output (geographic locality) at the very beginning, when the training set is built. In other words, the most practical model always requires large data sets, along with the optimization and balancing of EV, CV, and AR values.

RESULTS AND DISCUSSION

For the 138 nephrite samples from the eight locations, the concentration of elements from Li to U (45 elements total) were obtained by LA-ICP-MS measurement. To make our classification model independent of sample color, the transition metal elements (Ti, V, Cr, Mn, Fe, Co, Ni, and Cu) were excluded from further data analysis. Only 34 trace elements were involved in creating the LDA model. The mean value and standard deviation value of each trace element are calculated based on 60 detection points for each origin, as shown in table 2. 
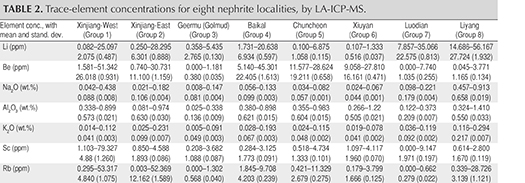
Table 2

Trace-Element Analysis to Separate Liyang from Other Origins. As shown in table 2, the nephrite samples from Liyang (group 8) displayed much higher concentrations of Sr (>140 ppm) and Na2O+K2O (>0.57 wt.%) than the other seven localities (Sr<40 ppm, Na2O+K2O <  0.56 wt.%). These results confirmed previously reported conclusions (Zhang et al., 2011; Siqin et al., 2012; Ling et al., 2013) that the distinctive Sr, Na, and K concentrations could be used as a quantitative discriminant to separate Liyang nephrite samples. These obvious diagnostic chemical signatures rendered further analysis of Liyang nephrite unnecessary. The only real challenge was to distinguish the remaining seven nephrite origins. Table 2 shows overlapping trace-element distributions. Therefore, it is important to derive effective discriminants from the trace elements to separate the origins.

Traditional LDA in Dolomite-Related Nephrite Origin Determination. From the outset, we attempted to use the traditional LDA method to classify the seven dolomite-related nephrite localities at once. Each nephrite locality is classified as a group, and every input trace element represents an independent variable. Seven linear discriminant functions (DFs) for seven independent nephrite groups were built simultaneously. The results showed that only the Luodian samples had an isolated distribution region, while the other six localities still exhibited overlap. The full classification of all seven groups by “one-pass” LDA must balance variance among all seven groups. This may be the reason why traditional LDA presented a relatively low CV of 91.4 % and a relatively low EV of 4.48 with a training set size of 40 testing points for each group. For the details of DFs and CV, again see box A.

IB-LDA to Optimize the Separation of Dolomite-Related Nephrite Geographic Origins. If only aiming to distinguish one group from all the others while ignoring the differences within the remaining unclassified groups, certain group identities should be more accurate and distinguishable. Hence, we designed the “iterative-binary” LDA (IB-LDA) to optimize the separation. The procedure used to build the discriminant function and criteria database for all seven origins is described in box A.

Classifying different sources of dolomite-related nephrite by IB-LDA is analogous to sorting blocks with different shapes by putting them into the corresponding holes. As shown in figure 4, seven blocks represented seven different dolomite-related nephrite origins. The red triangle, pink four-pointed star, purple five-pointed star, yellow six-pointed star, green square, blue pentagon, and orange hexagon represented Luodian, Xiuyan, Chuncheon, Xinjiang-West, Baikal, Xinjiang-East, and Geermu (Golmud) respectively. We then needed to build corresponding blocks with differently shaped holes (named “chosen sieves” hereafter) using the training set samples. The original 280 training set samples from the seven origins were used to create seven chosen sieves in sequence after six rounds of IB-LDA processes (figure 4). The different holes represent different DFs built for each chosen sieve. The sequence of those chosen sieves directly corresponds to the six rounds of IB-LDA, which must be unchanged to maintain the validity of the classification method. We found that the IB-LDA model produces better CV and EV values than traditional LDA, as shown in table A-1, which indicates IB-LDA can effectively improve the accuracy and validity of the sieves (classification model).

Diagram of iterative-binary LDA sequence
Figure 4. These blocks illustrate the process of determining the dolomite-related nephriteorigins by IB-LDA. The first step is building the “chosen sieves” sequence through six roundsof IB-LDA using the “training set” samples. The boxes had different holes corresponding to“chosen sieves” with discriminant functions in each round of IB-LDA. The second step (inset)is to use these sieves to determine the origins of testing set samples step by step in a blindtest. Four test set samples from each origin were chosen randomly from the total data set,excluding the training set samples.

Next, we evaluated the performance of the sieves built by IB-LDA on unincluded data in a blind test. Four new samples from each origin were used as a testing set to check the reliability and accuracy of the established chosen sieves (figure 5). All samples were treated as “unknown” blocks to be tested on the seven sieves in sequence. When the unknown block fit into the correct sieve, its “shape” was identified. For example, the first chosen sieve (Luodian) allowed only the triangular blocks to be sorted out, which meant only Luodian samples could be identified and all the other samples were still in an “unseparated” status. The unseparated samples went through the second IB-LDA process, where a four-pointed star sieve representing Xiuyan was used to extract appropriately shaped blocks, and the unseparated pool was reduced once more.
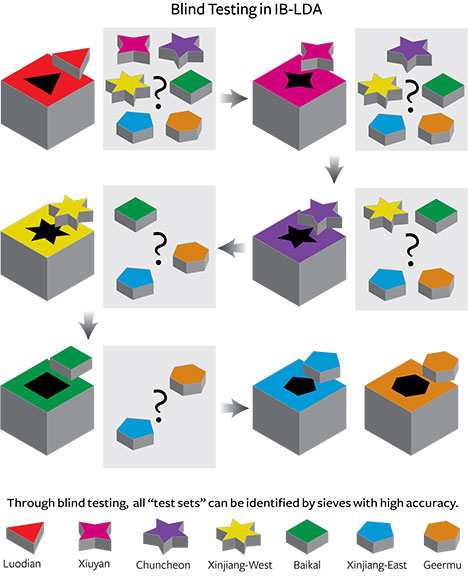
Diagram of iterative-binary LDA sequence
Figure 5. The schematic diagram of the blind test, the second step in IB-LDA. Only when the shape of an “unknown” block agrees with one of the sieve shapes can its origin bedetermined.

This process should be repeated until all the unseparated blocks can be identified. The number of test sets with the correct classification divided by the number of the total test sets is the accuracy rate (AR) for such blind testing. The same blind test is performed five times on different test sets, and the average AR is calculated. We note that the AR value obtained is generally consistent with the CV value calculated in the first step of IB-LDA, as shown in table A-1.

CONCLUSIONS

We propose that an IB-LDA model, combined with trace-element information from LA-ICP-MS, is an effective method for determining the origin of dolomite-related nephrite deposits. We consider the application of IB-LDA to the quantitative classification of nephrite origin a significant improvement over the traditional method. The origin information reflected by trace-element data has been well explored and applied in nephrite origin determination. The LDA method presents obvious statistical advantages in dealing with the massive quantity of nephrite trace-element data. Finally, the successful performance of IB-LDA remarkably improved discriminant accuracy, increasing the CV accuracy rate from 91.4% in traditional LDA to 94.4% and identifying CVorNi values specific to each origin. The discriminant functions database built by IB-LDA obtained a 95.0% accuracy rate in the testing of 28 unknown samples. We believe that collecting and accumulating more nephrite samples for use as training sets will further improve the reliability of the discriminant function database. The IB-LDA method should also prove useful for the origin determination of other gemstones.
Dr. Zemin Luo is a member of the Center for Innovative Gem Testing Technology (CIGT), a lecturer at the Institute of Gems and Jewelry Studies (IGJS), and a fellow of the Geology Postdoctoral Research Station, at the China University of Geosciences (Wuhan). Prof. Mingxing Yang is the dean of the IGJS and leader of the classification group at CIGT. Prof. Andy H. Shen is a Hubei 100 Talent Distinguished Professor at the IGJS and the director of the CIGT.

The nephrite samples were provided by the jade study group at the China University of Geosciences (Wuhan). This work was financially supported by the Fundamental Research Funds for the Central Universities (20140139043), the Natural Science Fund of Hubei Province (2014CFB347), Quality Industry Research Special Funds for Public Welfare Projects (201210228), and Research Fund of Center for Innovative Gem Testing Technology (CIGTXM-201401). Sincere thanks to Prof. Yongsheng Liu and Prof. Zhaochu Hu for providing LA-ICP-MS testing at the State Key Laboratory of Geological Processes and Mineral Resources, China University of Geosciences (Wuhan). The authors also thank the manuscript’s three peer reviewers for their constructive comments and suggestions.

Adamo I., Bocchio R. (2013) Nephrite jade from Val Malenco, Italy: Review and update. G&G, Vol. 49, No. 2, pp. 98–106, http://dx.doi.org/10.5741/GEMS.49.2.98

Adams C.J., Beck R.J., Campbell H.J. (2007) Characterisation and origin of New Zealand nephrite jade using its strontium isotopic signature. Lithos, Vol. 97, Nos. 3–4, pp. 307–322, http://dx.doi.org/10.1016/j.lithos.2007.01.001

Blodgett T., Shen A.H. (2011). Application of discriminant analysis in gemology: Country-of-origin separation in colored stones and distinguishing HPHT-treated diamonds. Proceedings of the Fifth International Gemological Symposium, G&G, Vol. 47, No. 2, p. 145.

Breeding C.M., Shen A.H. (2010) LA-ICP-MS analysis as a tool for separating natural and synthetic malachite. News from Research, Oct. 11, http://www.gia.edu/gia-news-research-nr101410

Buyukozturk S., Cokluk-Bokeoglu O. (2008) Discriminant function analysis: Concept and application. Eurasian Journal of Educational Research, Vol. 33, pp. 73–92.

Cawley G.C., Talbot N.L.C (2003) Efficient leave-one-out cross-validation of kernel fisher discriminant classifiers. Pattern Recognition, Vol. 36, No. 11, pp. 2585–2592, http://dx.doi.org/
10.1016/S0031-3203(03)00136-5

Fisher R.A. (1936) The use of multiple measurements in taxonomic problems. Annals of Eugenics, Vol. 7, pp. 179–188, doi:10.1111/j.1469-1809.1936.tb02137.x

Guo Y.Q., Hastie T., Tibshirani R. (2007) Regularized linear discriminant analysis and its application in microarrays. Biostatistics, Vol. 8, No. 1, pp. 86–100, http://dx.doi.org/
10.1093/biostatistics/kxj035

Harlow G.E., Sorensen S.S. (2005) Jade (nephrite and jadeitite) and serpentinite: Metasomatic connections. International Geology Review, Vol. 47, No. 2, pp. 113–146, http://dx.doi.org
/10.2747/0020-6814.47.2.113

He G.M. (2009) English and Chinese culture connotation. Asian Social Science, Vol. 5, No. 7, pp. 160–163, http://www.ccsenet
.org/journal/index.php/ass/article/view/2985

Jochum K.P., Willbold M., Raczek I., Stoll B., Herwig K. (2005) Chemical characterization of the USGS reference glasses GSA-1G, GSC-1G, GSD-1G, GSE-1G, BCR-2G, BHVO-2G and BIR-1G using EPMA, ID-TIMS, ID-ICP-MS and LA-ICP-MS. Geostandards and Geoanalytical Research, Vol. 29, No. 3, pp. 285–302, http://dx.doi.org/10.1111/j.1751-908X.2005.tb00901.x

Kohavi R. (1995) A study of cross-validation and bootstrap for accuracy estimation and model selection. Proceedings of the Fourteenth International Joint Conference on Artificial Intelligence, Vol. 2, No. 12, pp. 1137–1143. Morgan Kaufmann, San Mateo, California.

Liao R.Q., Zhu Q.W. (2005) Chemical composition analysis of nephrites from different localities in China. Journal of Gems and Gemmology, Vol. 7, No. 1, pp. 25–30 [in Chinese].

Ling X.X., Schmadicke E., Wu R.H., Wang S.Q., Gose J. (2013) Composition and distinction of white nephrite from Asian deposits. Neues Jahrbuch Mineralogie – Abhandlungen, Vol. 190, No. 1, pp. 49–65, http://dx.doi.org/10.1127/0077-7757/2013/0229

Liu J., Cui W.Y. (2002) Study on nephrite (tremolite jade) from three localities in China. Journal of Gems and Gemmology, Vol. 4, No. 2, pp. 25–29 [in Chinese].

Liu Y., Hu Z., Gao S., Günther D., Xu J., Gao C., Chen H. (2008) In situ analysis of major and trace elements of anhydrous minerals by LA-ICP-MS without applying an internal standard. Chemical Geology, Vol. 257, Nos. 1–2, pp. 34–43, http://dx.doi.org/10.1016/j.chemgeo.2008.08.004

Liu Y.S., Hu Z.C., Zong K.Q., Gao C.G., Gao S., Xu J., Chen H.H. (2010) Reappraisement and refinement of zircon U-Pb isotope and trace element analyses by LA-ICP-MS. Chinese Science Bulletin, Vol. 55, No. 15, pp. 1535–1546.

McLachlan G.J. (2004) Discriminant Analysis and Statistical Pattern Recognition. John Wiley and Sons, Hoboken, New Jersey.

Pearce N.J.G., Perkins W.T., Westgate J.A., Gorton M.P., Jackson S.E., Neal C.R., Chenery S.P. (1997) A compilation of new and published major and trace element data for NIST SRM 610 and NIST SRM 612 glass reference materials. Geostandards and Geoanalytical Research, Vol. 21, No. 1, pp. 115–144, http://dx.doi.org/10.1111/j.1751-908X.1997.tb00538.x

Shen A.H., Koivula J.I., Shigley J.E. (2011) Identification of extraterrestrial peridot by trace elements. G&G, Vol. 47, No. 3, pp. 208–213, http://dx.doi.org/10.5741/GEMS.47.3.208

Shen A.H., Blodgett T., Shigley J.E. (2013) Country-of-origin determination of modern gem peridots from LA-ICPMS trace-element chemistry and linear discriminant analysis (LDA). Geological Society of America Abstracts with Programs, Vol. 45, No. 7, p. 525.

Siqin B., Qian R., Zhuo S.J., Gan F.X., Dong M., Hua Y.F. (2012) Glow discharge mass spectrometry studies on nephrite minerals formed by different metallogenic mechanisms and geological environments. International Journal of Mass Spectrometry, Vol. 309, pp. 206–211, http://dx.doi.org/10.1016/j.ijms.2011.10.003

Tang Y.L., Chen B.Z., Jiang R.H. (1994) Zhongguo Hetian yu (Hetian Jade of China). Xinjiang People’s Press, Xinjiang, China, pp. 160–200 [in Chinese].

Tsien H.H., Lo H.J., Lin S.B. (1996) Crystal growth and whitening of archaic tremolite yu. Acta Geologica Taiwanica, Vol. 32, pp. 131–147.

Welling M. (2005) Fisher linear discriminant analysis. Department of Computer Science, University of Toronto, http://www.cs.huji.ac.il/~csip/Fisher-LDA.pdf

Wen G. (2001) Ancient Chinese jade and the jade age (translation from Zhongguo guyu yuqi shidai by E. Childs-Johnson). In E. Childs-Johnson, Ed., Enduring Art of Jade Age China: Chinese Jades of Late Neolithic through Han Periods, Throckmorton Fine Art, New York, pp. 31–34.

Wen G., Jing Z. (1996) Mineralogical studies of Chinese archaic jade. Acta Geologica Taiwanica, Vol. 32, pp. 55–83.

Wu R.H., Zhang X.H., Li W.W. (2002) Petrological characteristics of Hetian jade in Xinjiang and nephrite from Baikal area in Russia: Acta Petrologica et Mineralogica (Sinica), Vol. 21, supp., pp. 134–142 [in Chinese].

Yu H., Yang J. (2001) A direct LDA algorithm for high-dimensional data - with application to face recognition. Pattern Recognition, Vol. 34, No. 10, pp. 2067–2069.

Yui T.F., Kwon S.T. (2002) Origin of a dolomite related jade deposit at Chuncheon, Korea. Economic Geology, Vol. 97, No. 3, pp. 593–601, http://dx.doi.org/10.2113/gsecongeo.97.3.593

Zhang Z.W., Gan X.F. (2011) Analysis of the chromite inclusions found in nephrite minerals obtained from different deposits using SEMEDS and LRS. Journal of Raman Spectroscopy, Vol. 42, pp. 1808–1811.

Zhang Z.W., Gan X.F., Cheng H.S. (2011) PIXE analysis of nephrite minerals from different deposits. Nuclear Instruments and Methods in Physic Research B, Vol. 269, No. 4, pp. 460–465, http://dx.doi.org/10.1016/j.nimb.2010.12.038

Zhang Z.W., Xu C.Y., Cheng H.S., Gan X.F. (2012) Comparison of trace elements analysis of nephrite samples from different deposits by PIXE and ICP-AES. X-Ray Spectrometry, Vol. 41, pp. 367–370.

Zhong Y.P. Qiu Z.L., Li L.F., Gu X.Z., Luo H., Chen Y., Jiang Q.Y. (2013) REE composition of nephrite jades from major mines in China and their significance for indicating origin. Journal of the Chinese Society of Rare Earth, Vol. 31, No. 6, pp. 738–748, http://dx.doi.org/10.11785/S1000–4343.20130615 [in Chinese].