Fluorescence Produced by Optical Defects in Diamond
ABSTRACT
Three-dimensional fluorescence spectra were collected from both natural-color and treated diamonds with common color centers (including N3, H3, H4, 480 nm, and N-V) to characterize the fluorescence produced by each defect. Unlike individual spectra, 3D presentations of multiple spectra allow quick and simultaneous determination of the fluorescence-producing defect(s), the excitation energy that yields maximum fluorescence intensity, the variation of fluorescence with excitation, and the peak position and band shape of individual and overall fluorescence emissions. The combination of 3D fluorescence spectra from common defects and emission spectra from several standard ultraviolet light sources revealed noticeable inconsistencies in the fluorescence observed. Our data indicate that variations in UV lamp output can significantly affect the fluorescence color observed in gem diamonds.
INTRODUCTION
Fluorescence is the emission of electromagnetic radiation (e.g., visible light, ultraviolet light, X-rays, and gamma rays) from a substance, stimulated by the absorption of incident electromagnetic radiation. The emission persists only as long as the stimulating radiation is continued. The terms fluorescence and photoluminescence often appear interchangeably, but gemologists commonly use the former to describe the visible light emission from ultraviolet (UV) excitation. In most cases the emitted light has a longer wavelength, and therefore lower energy, than the absorbed radiation. Diamonds containing no defects or impurities generally do not absorb visible and UV light (230 nm) and thus produce no color or fluorescence. But when impurities or defects (often referred to as color centers) are present, they may absorb visible and UV light to produce color, fluorescence, or both. In diamonds with multiple color centers, the fluorescence from one defect may even excite the emission from another center more efficiently than the external UV light. Conversely, the fluorescence from one color center may be absorbed by other defects, dramatically reducing the overall fluorescence. Phosphorescence commonly refers to visible light emitted by a diamond after the stimulating UV light source has been discontinued. While related to fluorescence, it is a relatively uncommon visual property of gem diamonds and not a focus of this study.
Fluorescence in diamonds has been studied for nearly a century (e.g., Becquerel, 1868; Mani, 1944; Shipley, 1947; Wild and Biegel, 1947; Cotty, 1956; Dyer and Matthews, 1958; Collins, 1974, 1982; Fritsch and Waychunas, 1994; Eaton-Magaña et al., 2007; Holloway, 2009; Shigley and Breeding, 2013). While much is known and published about diamond defects and fluorescence, most gemologists do not have ready access to this information. This article seeks to clearly outline the defects that cause fluorescence in diamond, and explain how the gemological tools used to evaluate this property may impact observations. For decades, investigations of diamond fluorescence have mainly focused on visual observation (Moses et al., 1997; figure 1), while more recent studies have dealt with individual spectra and the physics of individual defects. The application of 3D fluorescence spectroscopy has been limited. Eaton-Magaña et al. (2007) presented a few spectra for diamond in this format, and Hoover and Theisen (1993) investigated other colored gemstones with this approach.

Visual evaluation of fluorescence is standard practice in gemological laboratories, and fluorescence color and intensity are often documented on laboratory reports. When selecting diamonds, jewelers also rely on fluorescence to ensure a good color match under a variety of lighting circumstances. The most common excitation source is a handheld UV lamp, which often has dual modes for long-wave (LW) and short-wave (SW) UV radiation. The typical color centers in diamond fluoresce more intensely under LWUV excitation. Fluorescence assessment relies mainly on visual observation at room temperature—fluorescence can vary in intensity and color at different temperatures—and sometimes requires a set of reference diamonds for comparison. Observation of fluorescence can be affected by three main factors: (1) the nature of the emission from the UV light source; (2) the nature of the defect(s) responsible for the fluorescence; and (3) methodology, including the viewing geometry and the distance from the radiation source. Within current industry practices, complications exist for each of these factors.
First, the excitation produced by different light sources may vary and not consist of “pure” LWUV or SWUV light, which generally have wavelengths of 365 nm and 254 nm, respectively. Differences in excitation wavelengths between lamps may produce inconsistent fluorescence reactions. Warm-up time, the materials used in the UV filters, and aging of lamps and filters can also affect the radiation output. Secondly, multiple defect centers may exist within the same diamond and produce different emission peaks simultaneously. To the human eye, multiple emissions combine to produce a single, albeit mixed, fluorescence color (e.g., blue + yellow = apparent whitish fluorescence). Visual evaluation of fluorescence does not allow for identification of multiple defects or irregular emission peaks. Finally, the distance between the radiation source and the diamond as well as the stone’s orientation (table-down versus face-up) may produce noticeably different fluorescence by changing the amount of excitation energy that interacts with the diamond.
In this study, a high-resolution luminescence spectrometer was used to study fluorescence emissions from common color centers in gem diamonds by obtaining three-dimensional scans of excitation, emission, and fluorescence intensity. From the 3D scans, we can quickly and simultaneously determine the nature of observed fluorescence and the energy at which the fluorescence maximizes or changes by systematically varying the excitation energy wavelength. Furthermore, emission characteristics such as peak position and band shape that are characteristic of particular defect centers can be evaluated.
With detailed, direct knowledge of fluorescence-producing diamond defects in hand, we surveyed several common UV light sources to better understand how much variability exists in UV excitation and to further investigate the effect of UV source on observed fluorescence colors. While a few previous articles have made similar investigations (e.g., Eaton-Magaña et al., 2007; Pearson, 2011), our survey includes newer LED-based sources that have only recently seen widespread use in the industry. The outcome of this study could be beneficial to both the diamond industry and gemological laboratories in that accurate, consistent, and reproducible fluorescence measurements are vital for industry confidence. In addition, better methods for measurement of fluorescence from different defect centers may lead to more effective methods of detection and separation of natural, synthetic, and treated diamonds.
MATERIALS AND METHODS
Samples. Three-dimensional fluorescence spectra were collected from 25 faceted diamonds, including 19 natural-color samples and six treated by high-pressure, high-temperature (HPHT) and irradiation (table 1). GIA issues reports on thousands of colored diamonds each year, providing a large selection of samples. The diamonds in this study, all of which carried GIA reports indicating natural- or treated-color origin, were chosen as representative of their respective defect group. While multiple fluorescence-producing color centers occur in most diamonds, each of our samples was dominated by one of the following:
- N3 center
- H3 or H4 center
- 480 nm band
- N-V center
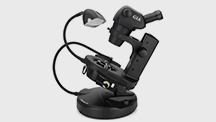
Emission Spectra from Industry UV Light Sources. To evaluate the excitation energy produced, we collected emission spectra from various UV light sources over the 200–900 nm range using an Ocean Optics USB 2000 CCD spectrometer with a UV-transmitting fiber-optic cable. Output spectra from five UV sources—including a GIA UV lamp (model 745000), a custom-made GIA fluorescence measurement device with UV LEDs (not shown), a handheld UVP Mineralight hobbyist lamp, a UV LED loupe, and a commercial 365 nm LED light source (figure 2, A–D)—were measured and output peak positions were recorded.
 a standard gemological UV lamp, (B) the Mineralight hobbyist lamp, (C) a commercial UV fluorescence loupe, (D) a fiber-optic LED light source, and (E) the Thermo ABII luminescence spectrometer. Photos by Eric Welch (A) and Christopher M. Breeding (B–E).")
3D Luminescence Spectroscopy. A Thermo Aminco Bowman II (ABII) luminescence spectrometer (figure 2E) was used to investigate the samples’ fluorescence. The analyses were conducted at room temperature to simulate typical observation conditions. Three-dimensional fluorescence spectra were recorded in the 300–750 nm emission range (2 nm resolution, 4 nm bandpass) using an excitation of 220 to 500 nm (5 nm intervals, 4 nm bandpass). Detector voltage was adjusted so that the highest peak in the spectrum comprised 80%–90% of the instrument’s maximum fluorescence intensity range. The ABII spectrometer is not configured with excitation filters, so most of the 3D spectra collected contained first-, second-, and sometimes third-order artifacts produced by the spectrometer grating at 1×, 2×, and 3× the excitation wavelength. In most of the spectra presented, the 2× and 3× artifacts have been removed. The 1× artifact was retained to avoid potential data loss.
Each 3D scan took approximately four hours to complete and consisted of 57 individual spectra. The advantage of a 3D plot is that all aspects of excitation and emission can be derived. Any of the 57 fluorescence emission spectra for a given excitation can be separated, and data for excitations not specifically analyzed can be interpolated. In addition, photoluminescence excitation (PLE) spectra for a given emission wavelength can be obtained to see the effect of excitation light frequency on fluorescence. Figure 3 illustrates these features in the anatomy of a 3D fluorescence spectrum.
 shows how a single spectrum (top left, blue line) at a given excitation (365 nm) can be extracted and examined in detail (bottom left). PLE excitation spectra can also be extracted from the 3D data (top left, red line and bottom right). Top right: Absorption (UV-Vis) and PL emission spectra confirm the presence of a defect such as N3 and relate to the data taken from a 3D spectrum. Fluorescence (bottom left) and PL (top right, blue line) emissions from the defect are similar and longer in wavelength than the ZPL, whereas PLE (bottom right) and UV-Vis absorption spectra (top right, red line) correlate and show defect-produced bands at wavelengths shorter than the ZPL.")
Additional Absorption and PL Spectroscopy. Ultraviolet/visible/near-infrared (UV-Vis-NIR), Fourier-transform infrared (FTIR), and photoluminescence (PL) spectra were collected to complement the fluorescence data, providing additional detail about the defects under more readily measurable conditions (again, see figure 3). UV-Vis-NIR spectra were collected with an Ocean Optics integrating sphere and HR 4000 CCD spectrometer over the 380–1000 nm range (~1 nm resolution) at ~77K temperature. FTIR spectra (not shown) were collected to identify diamond type using a Thermo Nexus 6700 FTIR spectrometer (6000–400 cm–1, 1 cm–1 resolution, 128 scans, room temperature). Breeding and Shigley (2009) describes diamond type and its use in gemology. Photoluminescence spectra were collected using a Renishaw inVia Raman microscope (325, 488, 514, 633, and 830 nm laser excitations, various scan ranges, and ~77K temperature).
RESULTS
UV Light Sources. GIA UV Lamp. Gemologists use conventional UV lamps (figure 2A) to observe a stone’s fluorescence color in response to long- or short- wave radiation. The lamps in this study were sold by GIA Instruments until 2009 and are still prevalent in the trade. It is well known that traditional UV lamps do not provide single characteristic 365 nm (LWUV) and 254 nm (SWUV) emission lines (Williams, 2007; Pearson, 2011) due to the variety of materials used in UV filters and the aging of lamps and filters. Rather than a single 365 nm emission peak, LWUV lamps often emit 404 and 435 nm lines and a broad band that extends from the UV to the visible region of the spectrum. Similarly, SWUV lamps always have distinct peaks at 254, 315, and 365 nm instead of a single 254 nm emission. All of these emission lines, as well as several weaker ones, are produced by the mercury lamp inside the units. The filter materials used to remove mercury radiation are not 100% efficient and leak undesired emissions. As the filters age, the leaked emissions become stronger and more prominent.
Examination of two handheld UV lamps manufactured by GIA and used at its laboratory revealed a major peak at 368 nm (FWHM = 17 nm) with LWUV excitation, accompanied by a small peak at 404 nm (figure 4A). In addition to the 252 nm (FWHM = 3 nm) SWUV emission, which shifted 2 nm from typical 254 nm SWUV, there were major peaks at 312, 365, 404, and 435 nm, as well as minor peaks at 296, 302, and 334 nm. Interestingly, the peak intensity at 365 nm (the typical LWUV emission) was more intense than the 252 nm SWUV peak (figure 4B), likely due to filter aging. The existence of this intense 365 nm peak in the excitation may have a pronounced effect on what is observed as SWUV fluorescence. Because most gemologists use UV lamps for many years and never replace the filters, these tests are representative of industry practices.

UVP Mineralight Lamp. The UVP Mineralight is another dual LW-SW lamp widely used in the industry and by hobbyists (figure 2B). Though similar in appearance and function to the GIA UV lamps, this lamp showed different results. LWUV excitation produced an intense broad band at 355 nm, along with the primary LW peak at 365 nm (FWHM = 37 nm) and weak emissions at 313, 405, and 437 nm. Short-wave excitation showed a similar array of peaks using the GIA lamp, with major emissions at 254 (FWHM = 4 nm), 313, and 366 nm, as well as minor peaks at 297, 303, 335, and 405 nm (figures 4C and 4D).
Note: Both the GIA and Mineralight lamps are able to produce LWUV and SWUV because they contain low-pressure mercury lamps that emit initially sharp mercury lines, but the phosphors inside the lamp are creating a conversion to broadband wavelengths at a longer wavelength. The lamps emit a range of light that spans both LWUV and SWUV. They are equipped with a daylight filter that removes most of the visible light so that mainly the desired UV band passes through the filter (R. Geurts, personal communication, 2012).
Digital GIA LED Fluorescence Device. GIA uses a custom-made fluorescence meter with LWUV LEDs to measure the fluorescence intensity documented on its diamond grading reports. Designed to improve fluorescence measurement consistency, this instrument uses an LED excitation source with a single emission peak at 367 nm and an FWHM of 14 nm (figure 4E).
UV LED Loupe. A generic commercial UV loupe sometimes used in the trade (figure 2C) was also examined. The LED excitation source from this loupe gave a single peak at 403 nm with an FWHM of 17 nm (figure 4F).
Commercial LED Light Source. For comparison with the other LED sources, we also tested a commercially available “365 nm” LED light source manufactured by Ocean Optics (figure 2D). This excitation source showed a single peak at 364 nm with an FWHM of 10 nm (figure 4G).
ABII Excitation Light Source. The ABII spectrometer (figure 2E) was selected to provide well-constrained, high-resolution fluorescence spectra. To understand how its excitation compared to that of other sources, different excitation wavelengths of the ABII CW Xenon source were examined (the instrument can produce excitation of 200–950 nm). As shown in figures 4H and 4I, when the instrument was set to 365 nm excitation with 4 nm bandpass, the resultant emission showed a narrow peak at 366 nm with an FWHM of 5 nm. With a 16 nm bandpass parameter (which most closely resembled the output of a GIA LW-UV lamp), a peak was observed at 367 nm with an FWHM of 15 nm. To precisely characterize the fluorescence from a given excitation wavelength, we chose the smallest available bandpass setting (4 nm), and thus the narrowest excitation emission, for the 3D-fluorescence spectra collection.
N3 Center. The N3 center is the most common color-producing defect in diamond, consisting of a vacancy surrounded by three nitrogen atoms on a {111} plane. The zero phonon line (ZPL), the identifying emission for N3, occurs at 415 nm. This line, along with a broadband emission with dominant peaks at 429, 439, and 450 nm, results in typical blue fluorescence (Collins, 1982).
Absorption and PL Spectroscopy. UV-Vis-NIR spectra for samples 1–7 all showed the N3-related ZPL at 415 nm. Sample 7 also showed a 550 nm band, which causes the stone’s pink bodycolor. FTIR analysis identified them as type Ia diamonds with both A and B nitrogen aggregates in various concentrations. Samples 1 and 3 showed more A aggregates, which are known to quench fluorescence (Collins, 1982), possibly explaining the weaker fluorescence observed (table 1). PL spectra confirmed the presence of N3 in sample 2 (figure 3). The 503.2 peak in the PL spectra of samples 1, 3, and 7 revealed an H3 center as well. The H3 center in sample 1 was the source of the visible greenish component of the fluorescence.

Fluorescence Spectroscopy. Among the seven diamonds examined in this category, six have color in the D-to-Z range (colorless to pale yellow) and one has a light pink color (figure 5). All seven showed relatively intense fluorescence emission, with the ZPL at 415 nm and three peaks at 429, 439, and 450 nm superimposed on a ~400–550 nm broadband, all characteristic of the N3 center (Eaton-Magaña et al., 2007). The 3D fluorescence spectra indicated that this N3-related emission reaches its maximum at 395 nm excitation energy and is not excited above 430 nm (figure 6). Figures 6A and 6B show fluorescence spectra collected on sample 2 but with different bandpass settings (4 and 16 nm). From these two spectra, it is clear that the bandpass does not affect the position or maximum intensity of N3 fluorescence. Similar results occurred for other defects. Although the bandpass of 16 nm most closely resembles the output of a handheld LWUV light source, the 4 nm bandpass chosen for all the 3D fluorescence spectra in this study adequately represented the corresponding excitation.


Aside from the N3-related emission, which is not active with excitation energy above 435 nm, sample 7 showed a 520 nm emission band with a maximum at 470 nm excitation. This feature is caused by the H3 center, which was observed from photoluminescence spectra in these three samples but not in the other four from this category. As stated earlier, most diamonds contain multiple color centers.
H3 and H4 Center. The H3 center consists of a vacancy trapped at an A aggregate of nitrogen, which gives an uncharged defect consisting of two nitrogen atoms separated by a vacancy—for instance, (N-V-N)0. Optical absorption at this center has a ZPL at 503 nm and creates a yellow bodycolor in diamond, while also commonly producing green luminescence with visible-light stimulation. The H4 center consists of four nitrogen atoms separated by two vacancies. It is created when a vacancy migrates through the diamond lattice and combines with a B aggregate of nitrogen. This center has a ZPL at 496 nm and typically produces yellow color in diamond. Both H3 and H4 centers can occur naturally or during treatment (Collins, 1982).
Seven diamonds were examined in this category, including six samples determined by GIA to be naturally colored and dominated by H3 and H4 (three each), as well as one HPHT-treated diamond dominated by H3 (samples 8–14; figure 5). Sample 8 is a Fancy Light greenish yellow stone that fluoresced strong yellow under LWUV and medium yellow under SWUV. Samples 9, 10, and 11 all have some combination of yellow and green bodycolors and exhibited an uneven fluorescence with blue and yellow zones. Samples 12, 13, and 14 have yellowish green bodycolors and showed very strong green fluorescence under both long- and short-wave UV.
Absorption and PL Spectroscopy. UV-Vis-NIR spectra showed the H3-related ZPL at 503 nm for samples 8, 9, 10, and 11, as well as ZPL at 415 nm from the N3 center. The H3 defect requires the presence of aggregated nitrogen, making the occurrence of N3 in such stones very likely. Samples 12, 13, and 14 showed H4-related ZPL at 496 nm in the UV-Vis-NIR spectra. FTIR analysis identified sample 8 as type IaA diamond, and samples 9, 10, and 11 as type Ia with both A and B aggregates in various concentrations. Samples 12, 13, and 14 are type IaB diamonds. Strong 503 nm peaks for samples 8, 9, 10, and 11 and 496 nm peaks for samples 12, 13, and 14 in the PL spectra further confirmed the presence of dominant H3 and H4 centers, respectively (figure 7D).

Fluorescence Spectroscopy. The 3D fluorescence spectra of samples 8–11 show an emission maximum at 520 nm with a wide band extending from ~480 to 650 nm, a feature that manifested itself as a green or yellowish green fluorescence (figures 7A and 7B). This emission feature is caused by H3 and has a maximum at 470 nm excitation. Unlike N3, the 503 nm ZPL of H3 is not seen at room temperature. The N3-related fluorescence feature was also observed with various intensities due to different defect concentrations (figure 7B). The spectrum for 365 nm excitation, which most closely approximates the LWUV lamp, showed both H3 and N3 emissions at relatively low intensity. Fluorescence spectra from the HPHT-treated sample (11) were not noticeably different from those of other H3-dominated natural-colored samples.

The 3D fluorescence spectra of samples 12–14 (see sample 12 in figure 7C) showed an emission peak centered at 512 nm with a band from ~470 to 630 nm that resulted in green color from H4 fluorescence. This emission feature increases at 395 nm excitation and maximizes at 470 nm. Similar to H3, the ZPL for H4 (496 nm) is not visible at room temperature but was clearly seen in liquid nitrogen–cooled PL spectra for these samples.
Both H3- and H4-related fluorescence emissions showed a broad fluorescence band at ~470 to 650 nm. But the H3 fluorescence peak is shifted to the higher-wavelength side and has a wider tail toward this direction, resulting in a yellowish fluorescence rather than the green fluorescence of H4 (figure 8).
480 nm Band. Although the structure of the 480 nm band is not understood, it is known to be associated with yellow fluorescence in diamond. Six diamonds with 480 nm bands in the UV-visible absorption spectra were examined (samples 15–20; figures 5 and 9). Four of the samples were naturally colored, and two were HPHT-treated. Samples 15–19 had a combination of orange and yellow in bodycolor and fluoresced strong yellow to orange and medium yellow to orange under long- and short-wave UV lamps, respectively. Sample 16 had a brownish color component as well. Sample 20 had yellow bodycolor and showed strong orange and medium orange fluorescence under long- and short-wave UV, respectively.

Absorption and PL Spectroscopy. UV-Vis-NIR spectra showed the typical 480 nm absorption band for all six samples (figure 9D). FTIR analysis identified all of them as type IaA diamonds with traces of isolated nitrogen. Sample 18 contained much higher concentrations of aggregated nitrogen impurities than the other samples. PL spectra at 514 nm excitation showed a wide band from 600 nm to more than 850 nm, typical of diamond with 480 nm bands.
Fluorescence Spectroscopy. 3D fluorescence spectra from 480 nm-band diamonds are complex. All of the samples showed two major features: (1) a wide band centered at ~653 nm (maximum shifts between 630 and 655 nm) that maximized with 485 nm excitation energy, and (2) a ~539 nm-band (maximum shifts between 505 and 541 nm) that increased with 420, 345, and 285 nm excitation energies (figure 9, A–C). The combination of both bands ranged from ~500 to 700 nm and produced yellow to orange fluorescence when excited by visible light (near-LWUV). The band in the red part of the spectrum (630–655 nm) could be excited independently of the ~539 nm band using longer-wavelength light. The fluorescence from this feature is likely the same as the PL broadband seen after excitation with a 514 nm laser. In general, the band’s intensity increased with the size of the 480 nm absorption band. No clear correlations explain the differences in the ~539 nm band. The two HPHT-treated samples showed no obvious systematic differences from the naturally colored samples.
N-V Center. The N-V center consists of a single nitrogen atom adjacent to a vacancy in the diamond lattice. The center can exist in an uncharged state, (N-V)0 with ZPL at 575 nm, or in a negative charge state, (N-V)– with ZPL at 637 nm. N-V defects are commonly associated with orange and red fluorescence (Collins, 1982).
We examined five diamonds with N-V centers (samples 21–25; figures 5 and 10): two naturally colored, two multi-treated, and one irradiation-treated. Samples 21 and 22 were brownish pink and very light pinkish brown natural-color diamonds that showed weak orange to red fluorescence under both long- and short-wave UV lamps. Samples 23–25 were red and deep pink diamonds that had undergone combination treatments (HPHT + irradiation + annealing; samples 23–24) or standard irradiation + annealing treatment (sample 25). The treated diamonds exhibited red fluorescence under both LWUV and SWUV lights.
Absorption and PL Spectroscopy. The UV-Vis-NIR spectra of samples 21 and 22 featured a broad 550 nm band (thought to be caused by plastic deformation) that contributed to their pink color, as well as the (N-V)– center at 637 nm. FTIR indicated type IIa stones with no measureable nitrogen or hydrogen impurities. PL spectra showed evidence for significant concentrations of (N-V)0, H3, and (N-V)– defects (figure 10D). For samples 23 and 24, UV-Vis spectra indicated an abundance of (N-V)– centers; FTIR identified them as type IaAB with traces of isolated nitrogen. PL spectra showed both (N-V)0 and (N-V)– centers as well as H3 defects. For sample 25, UV-Vis spectra indicated the presence of a strong (N-V)– center and FTIR demonstrated a low concentration of type Ib isolated nitrogen defects. PL spectra showed both (N-V)0 and (N-V)– centers, together with H3 centers.
Fluorescence Spectroscopy. The 3D fluorescence spectra for most of the N-V center samples are complicated by multiple fluorescence-producing defects, sometimes as many as three. Both naturally colored samples (21 and 22; figure 10A) showed the fluorescence emission feature of the (N-V)0 center, with ZPL at 575 nm and an emission band extending from 575 to more than 700 nm with peaks at 586, 600, and 618 nm. We also saw clear fluorescence from two defects: N3 (triplet peaks at 410–450 nm) and H3 (a 520 nm peak that maximized at 470 nm excitation). Despite its presence in PL spectra, fluorescence from (N-V)– was not observed in these samples. Sample 21 also displayed fluorescence of unknown origin at ~340–360 nm. The treated samples (23–25) contained both the (N-V)0 and (N-V)– centers as overlapping bands, with the latter fluorescence band dominating at 660 nm and extending beyond 750 nm (figures 10B and 10C). Sample 25 (figure 10C) featured only N-V defects in the fluorescence spectrum, consistent with the occurrence of mainly isolated nitrogen impurities (type Ib). Samples 23 and 24 contain aggregated nitrogen impurities and, as expected, showed fluorescence from N3 and H3 color centers.

DISCUSSION
UV Light Sources. Emissions from the widely used mercury-based UV lamps (GIA and UVP Mineralight lamps) do not contain pure 365 nm LWUV and 254 nm SWUV peaks, but instead show multiple excitation energies of widely varying bandwidths. Similarly, the popular LED UV loupe has a visible emission of 405 nm, rather than the standard for LWUV (365 nm). The emissions from GIA’s LED fluorescence meter and commercial LED light sources show a well-constrained LWUV emission in the 364–367 nm range. The variability in excitation wavelengths and bandwidths among commonly used lamps and LED UV sources demonstrates that the colors and intensities of observed fluorescence in a single sample can vary depending on the light source. UV lamp emissions tend to fluctuate according to the age of the bulbs and filters as well as warm-up times, making it very difficult to achieve consistent results from one source to another. LED sources are far more constrained in emission bandwidth and purity, but they are manufactured in such a wide range of wavelengths that consistency among different products remains a problem. Nevertheless, the well-controlled emissions suggest that LEDs can provide better accuracy and consistency in interpreting the fluorescence response to a LWUV source, as long as an LED near 365 nm is used.
Fluorescence Colors from Different Defect Centers. 3D fluorescence spectra provide an excellent opportunity to examine fluorescence produced by individual defects as well as the contributions of multiple defects. By directly depicting the relationship between UV excitation and fluorescence emission, these spectra illustrate the emission resulting from the various optical centers. Fluorescence spectra from diamonds dominated by individual color centers are relatively simple and consistent, as discussed for each defect in the Results section.
In most diamonds, multiple defect centers occur together. Even under pure 365 nm LWUV excitation, the fluorescence color will be a mixture of the fluorescence from different defect centers. The fluorescence may also have uneven zoning due to defect distributions. Visual observation alone is not an adequate basis for interpreting a diamond’s fluorescence color with respect to the corresponding defect centers. The energy of the excitation source can have a profound effect on the resulting fluorescence color and luminescence spectra, and it must be carefully considered.
Potential Effects of UV Light Sources on Fluorescence Color and Intensity. Analysis clearly shows that LWUV sources emit not only varying intensities and bandwidths of light at 365 nm, but also “extra” peaks resulting from mercury lamps and leaking filters. Our 3D fluorescence spectra demonstrate that small changes in excitation wavelength, even from a “pure” LWUV emission, can significantly affect the intensity and possibly the color of the fluorescence. For example, the intensity of N3 luminescence (measured at 439 nm) when excited by 400 nm excitation is approximately double that of the same emission measured at 360 nm excitation (figure 6). The mixture of the emission peaks from the UV lamp will affect the apparent color and intensity of the fluorescence, limiting the effectiveness and consistency of visual observation.

To illustrate the potential variations introduced by “extra” excitation energy, figure 11A shows the fluorescence emission peaks from sample 15 (extracted from the 3D fluorescence spectra of this sample containing the 480 nm band) at 365, 405, and 435 nm excitation energies. These are the three emission peaks measured from the GIA LWUV lamp (365 nm being the strongest). The spectra were processed to produce equivalent colors by conversion to equivalent CIE L*a*b* color values using GRAMS AI software (including artifact removal, 2° viewing angle, and CIE D65 illumination; all spectral intensities were scaled up 30× to facilitate color reproduction). The fluorescence peak generated by 365 nm excitation is centered at 520 nm, producing a green color with a slightly yellow tint, whereas the fluorescence peaks caused by 405 and 435 nm excitation energies are shifted up to ~545 nm with a tail extending beyond 750 nm, adding an orange-red component to the yellowish green fluorescence. The strong yellow fluorescence of this diamond under the conventional gemological UV lamp is a mixture of the three emission colors from these LW-UV excitation peaks. Under a “pure” 365 nm LED source, this diamond shows a yellowish green fluorescence. While it would be ideal to illustrate this effect with photos, we could not achieve a long enough exposure to photograph the fluorescence.
These multiple emission peaks from the handheld UV lamp can also affect the intensity of the fluorescence color observed. Figure 11B shows the fluorescence emission peaks from sample 7 (extracted from the 3D fluorescence spectra of its N3 center) at the same 365, 405, and 435 nm excitation energies used in the example above. Compared to 365 nm excitation, the fluorescence color with 405 nm excitation is almost twice as intense. The 435 nm excitation gives a relatively small emission peak centered at ~520 nm due to the presence of the H3 center, resulting in a weak green color. “Extra” emission from the conventional UV lamp at 405 nm causes the diamond’s blue fluorescence to be more intense than that from a “pure” 365 nm LED source. Such discrepancies contribute to problems with consistency and reproducibility of fluorescence observations within the industry.
Fluorescence as a Tool for Identifying Treatment. Although we tested a limited number of samples, some differences in the fluorescence behavior of natural and treated diamonds were observed. In diamonds with H3 or 480 nm band defects, 3D fluorescence spectra did not show significant differences between the natural-color and treated samples. Yet treated diamonds tended to show much more fluorescence from the (N-V)– center, partially overlapping with the band from the (N-V)0 center, whereas naturally colored stones showed a dominant (N-V)0 defect (again, see figure 10). Because the fluorescence from the (N-V)– center was much more intense in the treated diamonds and shifted to longer wavelengths of 750 nm, the fluorescence color from the treated diamonds with both N-V centers was a more intense red color than in the untreated samples with only the (N-V)0 center, which produced an orange color. While this trend for N-V centers after HPHT treatment is well documented (e.g., Fisher and Spits, 2000) and also proved true in this study, gemologists should not rely solely on the observation of orange or red fluorescence to ascertain diamond treatment.
CONCLUDING REMARKS
Testing of diamonds with various primary defect centers has shown that to define their fluorescence characteristics, a UV source with consistent output energy is necessary. Traditional gemological UV lamps and light sources used in the diamond industry produce widely variable emissions, making it difficult to achieve reproducible fluorescence observations. LED light sources can provide narrow, well constrained UV emissions to produce more reliable diamond fluorescence reactions.
This study characterizes the fluorescence generated by the most common defect centers in diamond. Changes in fluorescence relative to excitation energy were carefully examined to determine where fluorescence maxima occur for each defect, as well as the peak positions and band shapes that can impact fluorescence colors and intensities. Our findings demonstrate the diamond industry’s need for a standardized UV excitation source, to provide consistent and reproducible determinations of fluorescence.